Education
What Is Market Structure in Trading? The Order Flow Trader's Guide
Market structure defines trend, range, and reversal. Add order flow and stop guessing at breaks — see what caused them. Guide for crypto futures traders.
Deep dives on order flow, liquidity analysis, and how to use QuantFlows to trade smarter.
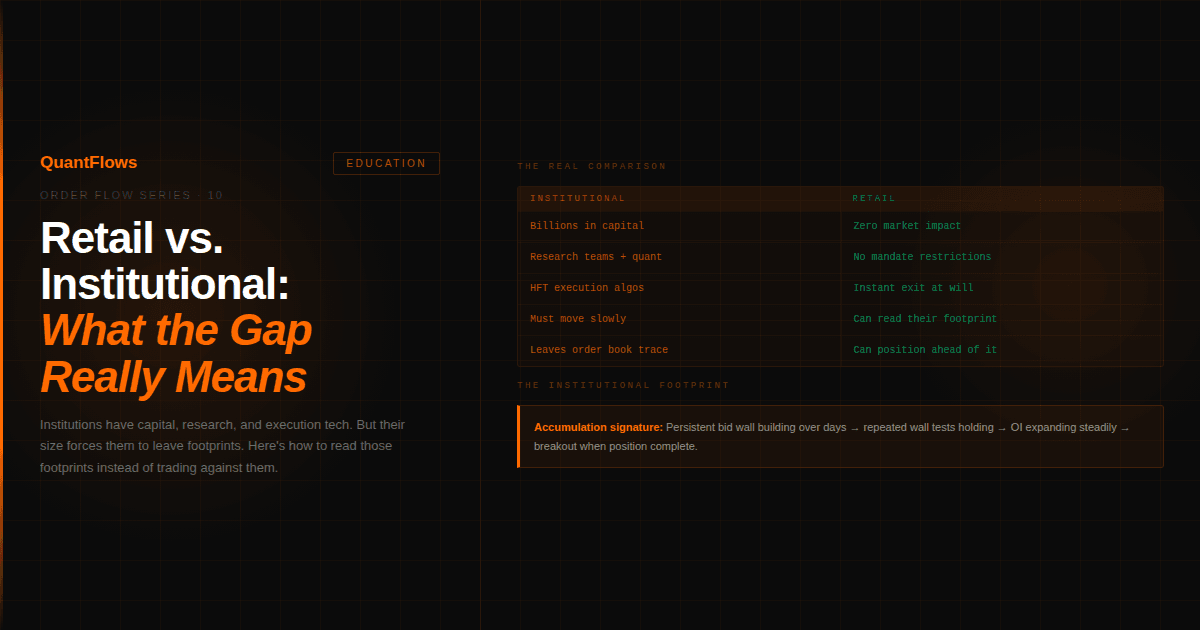
Institutional traders have more capital, better data, and faster execution. But their size creates a readable footprint. Here's what the gap actually looks like — and how to use it.
Market structure defines trend, range, and reversal. Add order flow and stop guessing at breaks — see what caused them. Guide for crypto futures traders.

Most traders read heatmaps wrong. Bright bands aren't always support. One-exchange views miss the full picture. Six fixable mistakes explained.
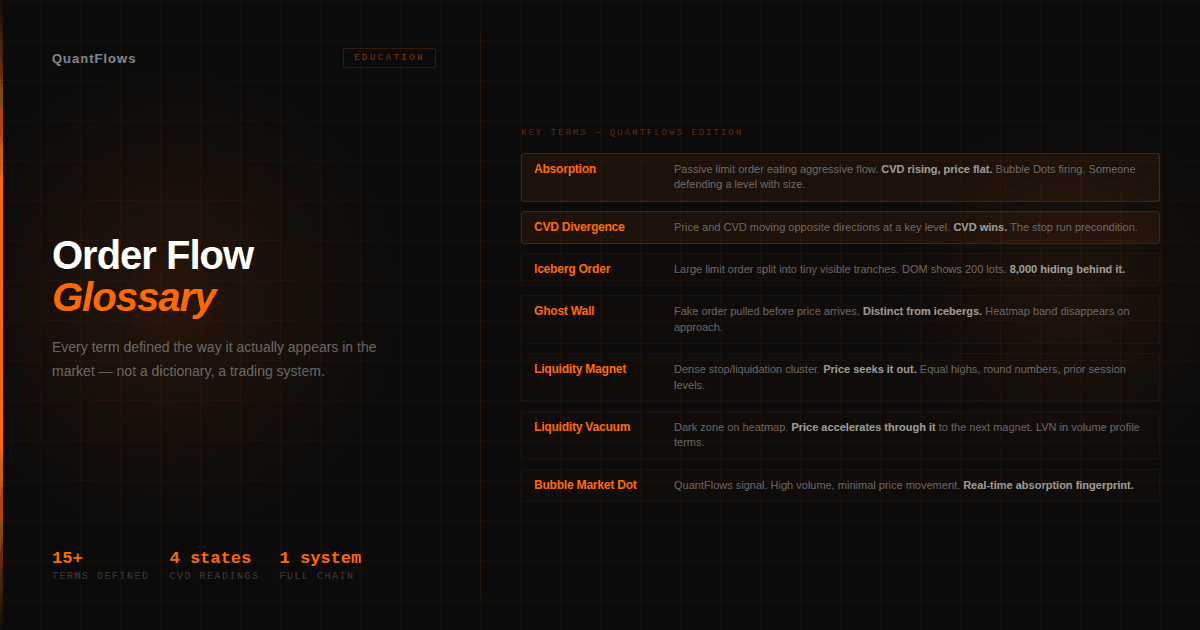
Every order flow term defined clearly — absorption, CVD, DOM, iceberg orders, liquidity vacuum, and more. Built for crypto futures traders.
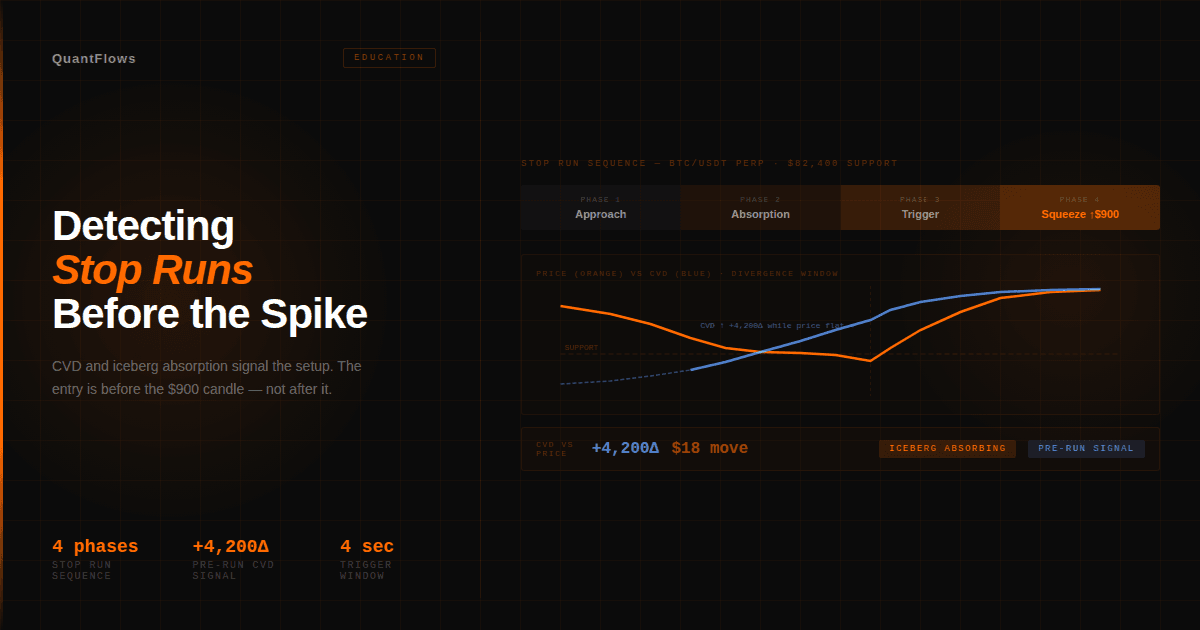
Stop runs follow a readable 4-phase sequence. CVD and iceberg absorption give you the signal before the spike — not after. Guide for crypto futures traders
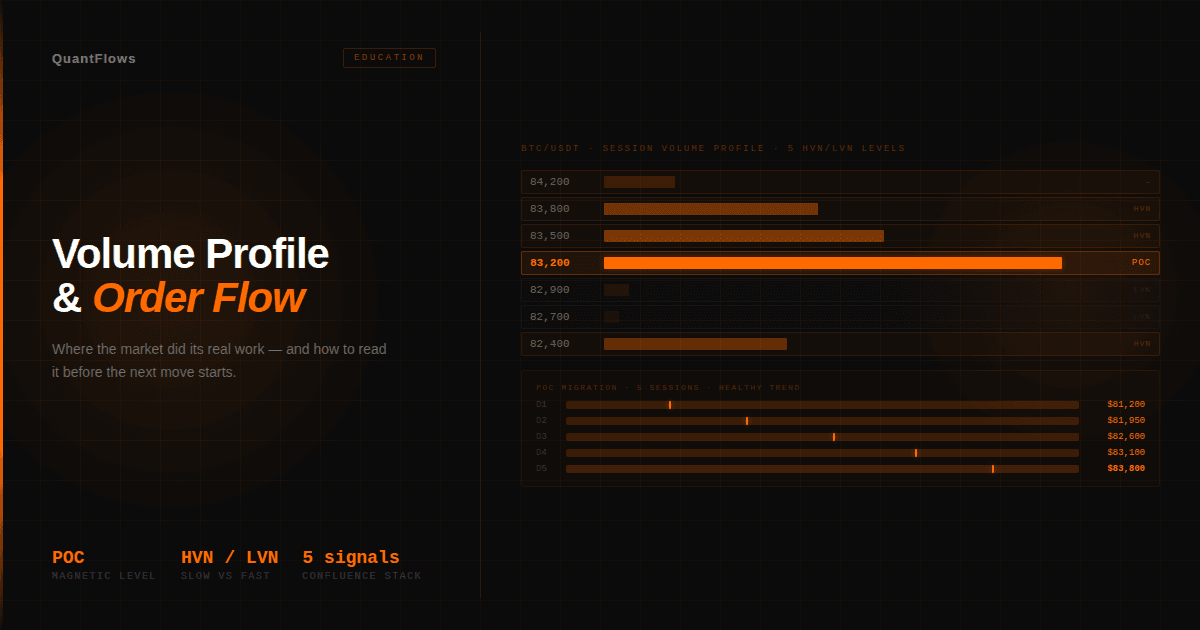
Volume profile shows where the market did its real work. Pair it with live order flow and stop guessing at support — you see it confirmed
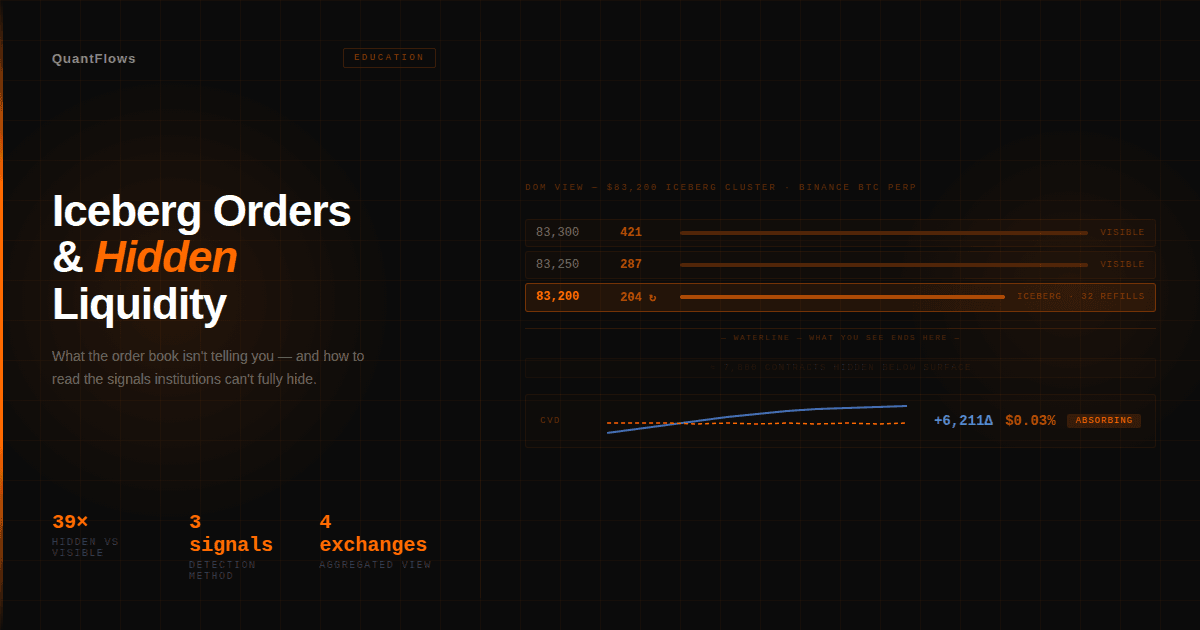
Iceberg orders hide institutional intent in plain sight. Detect hidden liquidity using heatmaps, CVD, and absorption signals in crypto futures.
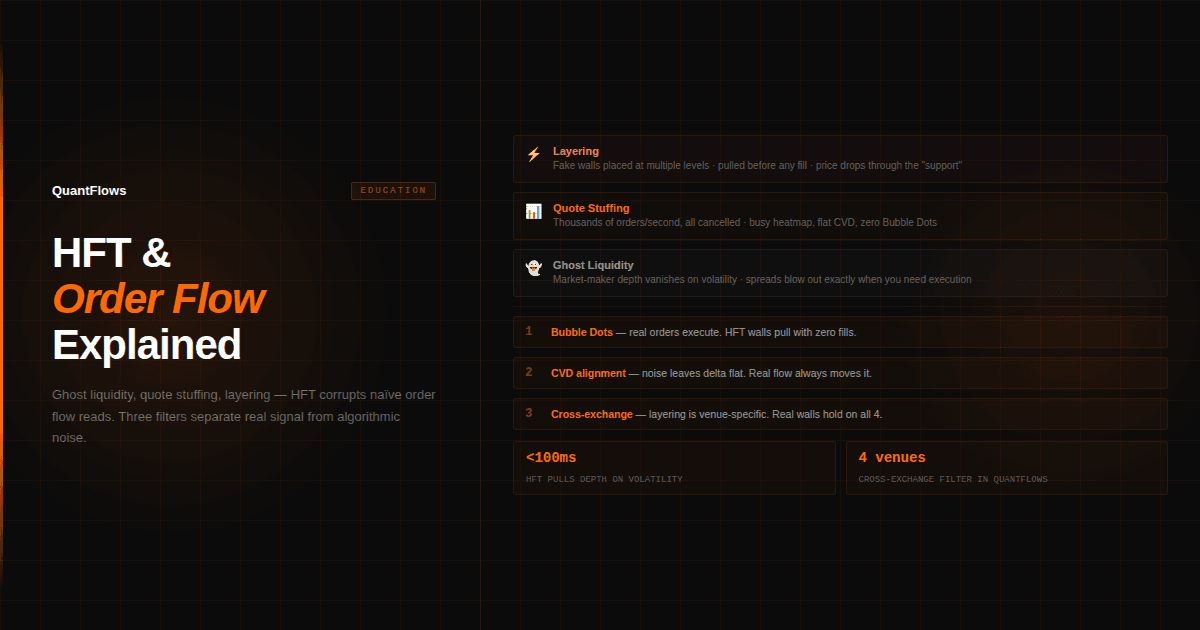
HFT dominates crypto order books — creating ghost liquidity, running quote stuffing, and layering fake walls. Learn to separate HFT noise from real order flow signal in crypto futures.
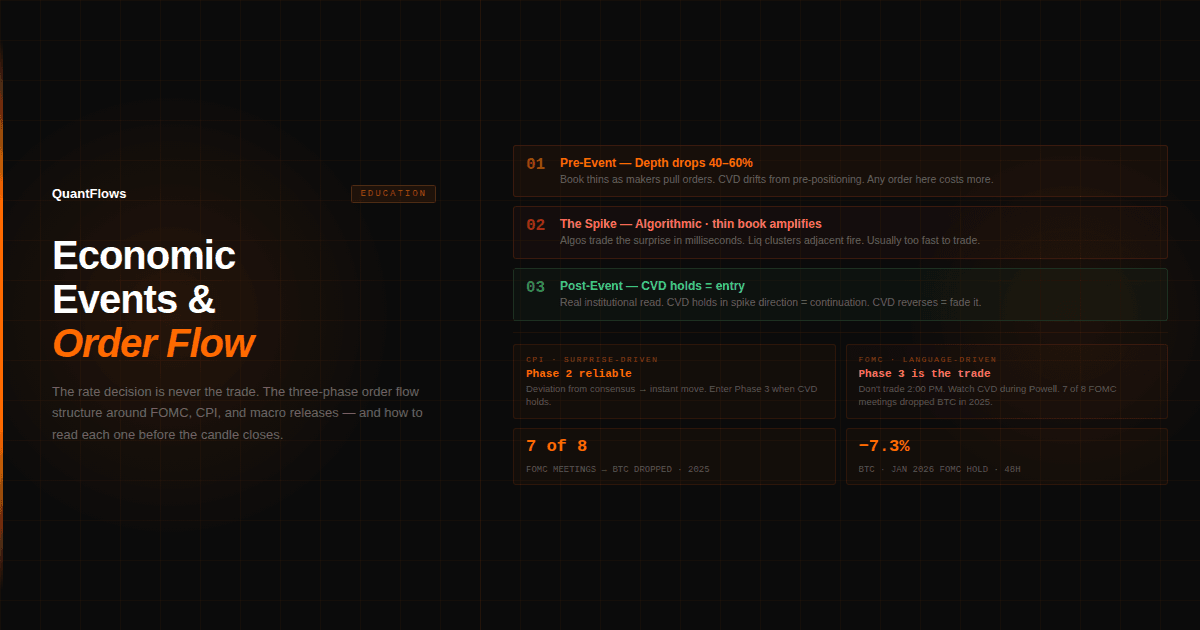
Economic events don't just move price — they reshape order flow before, during, and after the print. Learn to read FOMC, CPI, and macro releases through the heatmap and CVD in crypto futures.
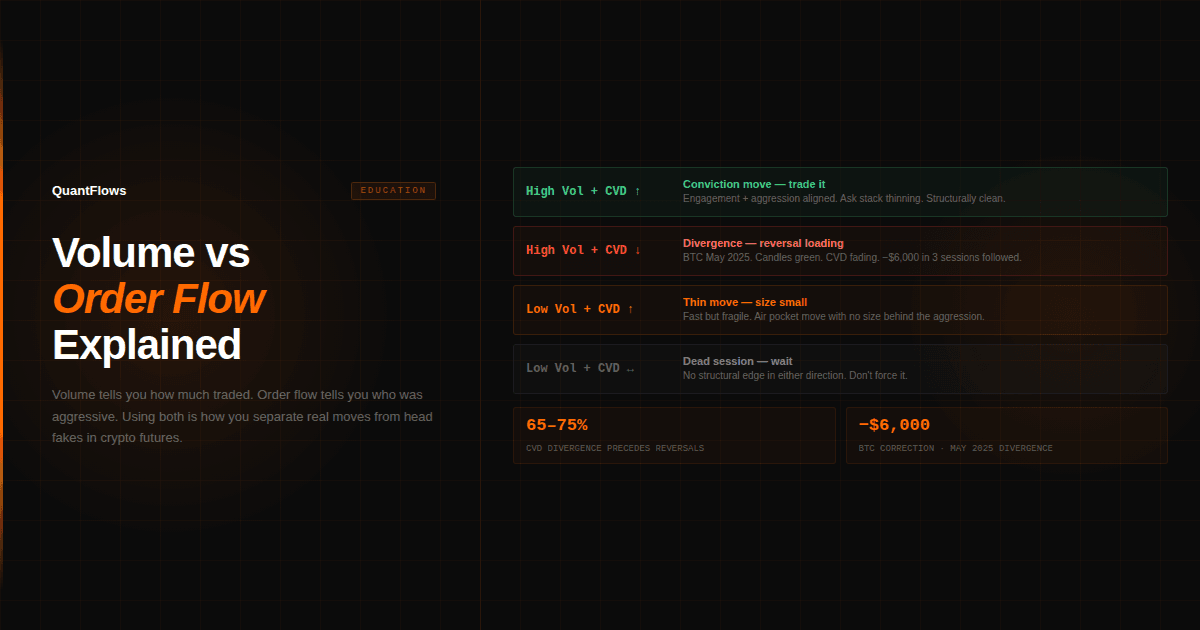
Volume tells you how much traded. Order flow tells you who was aggressive. Using both together is how you separate real moves from head fakes in crypto futures.
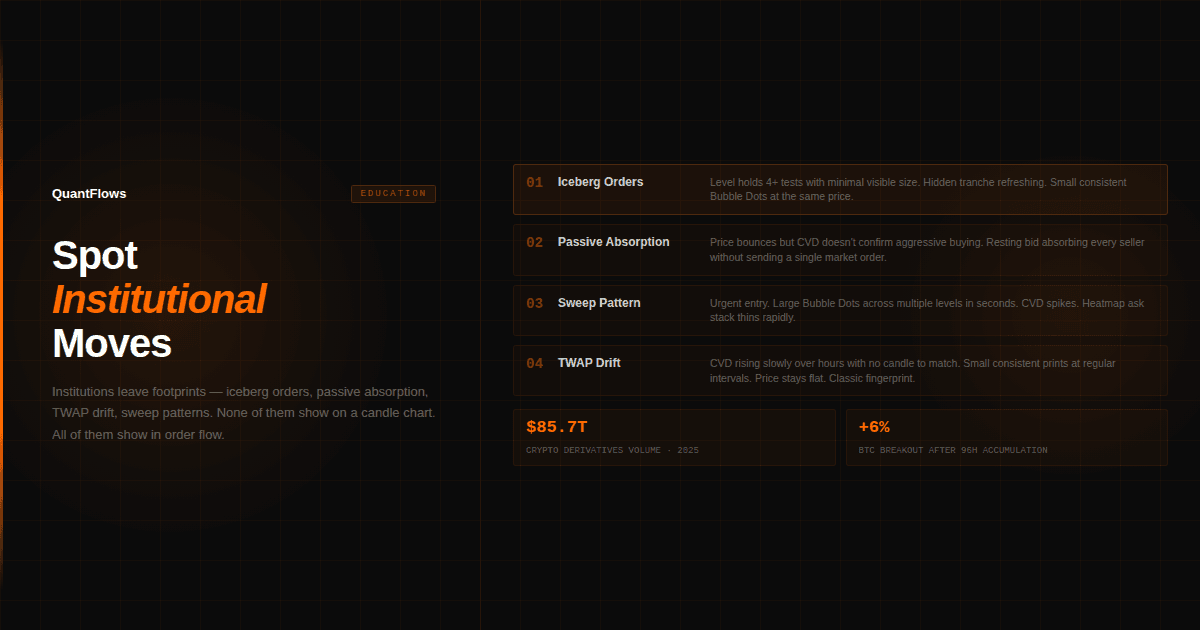
Institutional traders leave footprints — but not on candle charts. Learn to read iceberg orders, passive absorption, and TWAP patterns in crypto futures using order flow data.
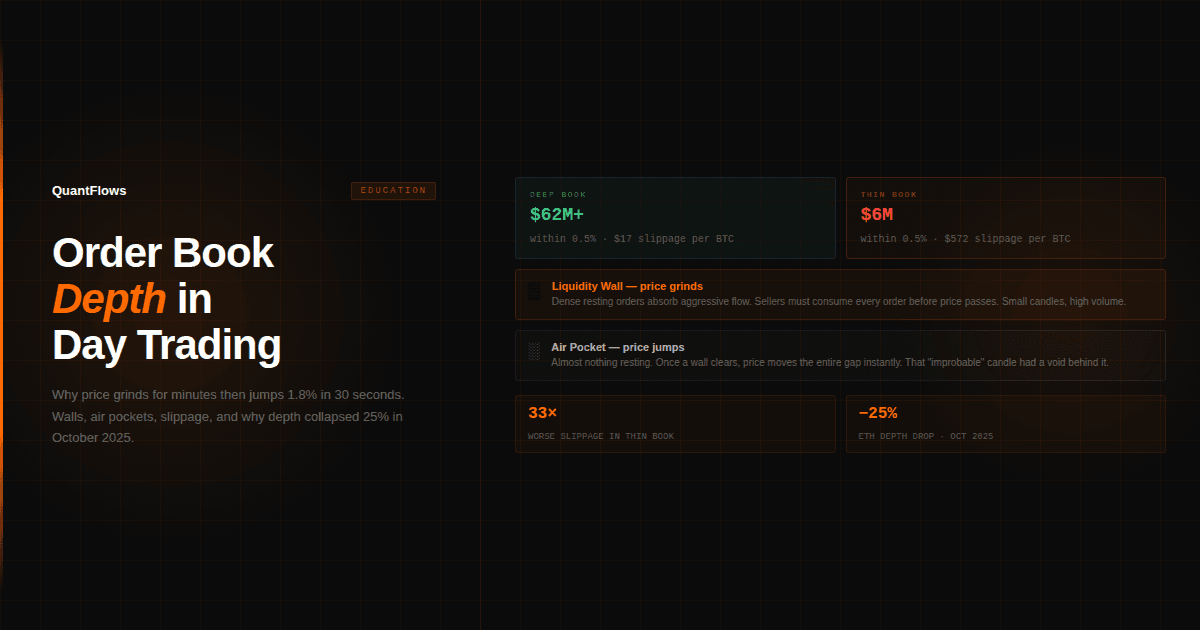
Order book depth determines how much your trade costs and how fast price moves. Learn to read deep vs thin books, spot walls and air pockets, and use depth data in crypto futures.
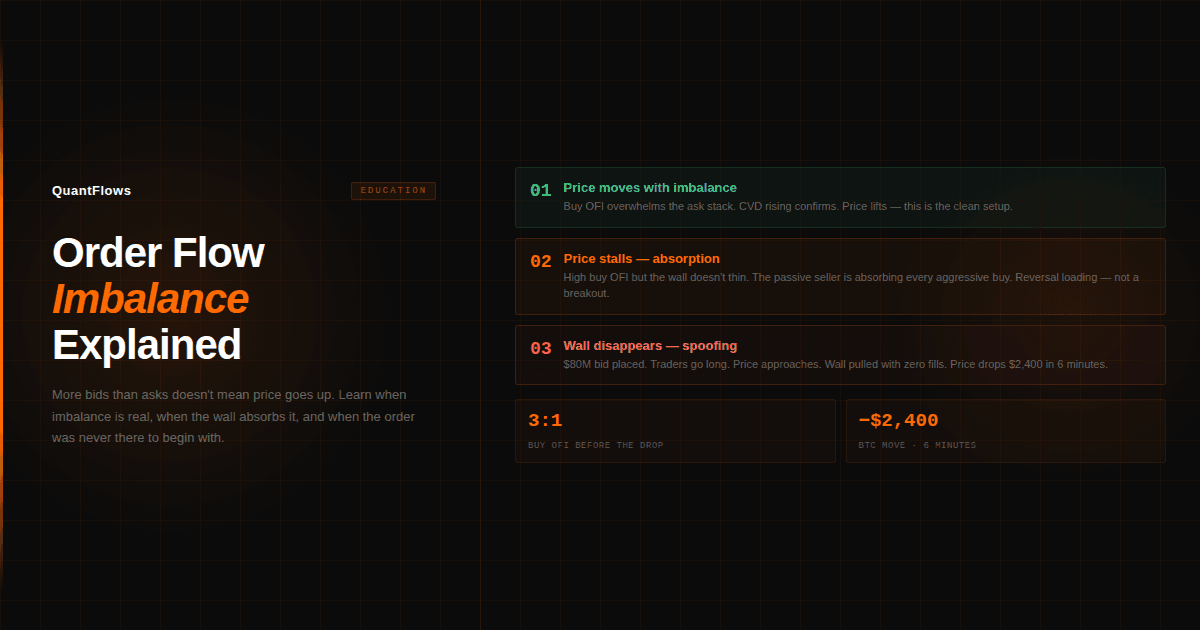
Order flow imbalance reveals which side of the book is winning — but only if you know what to trust. Learn to read imbalance, spot absorption, and identify spoofing in crypto futures.
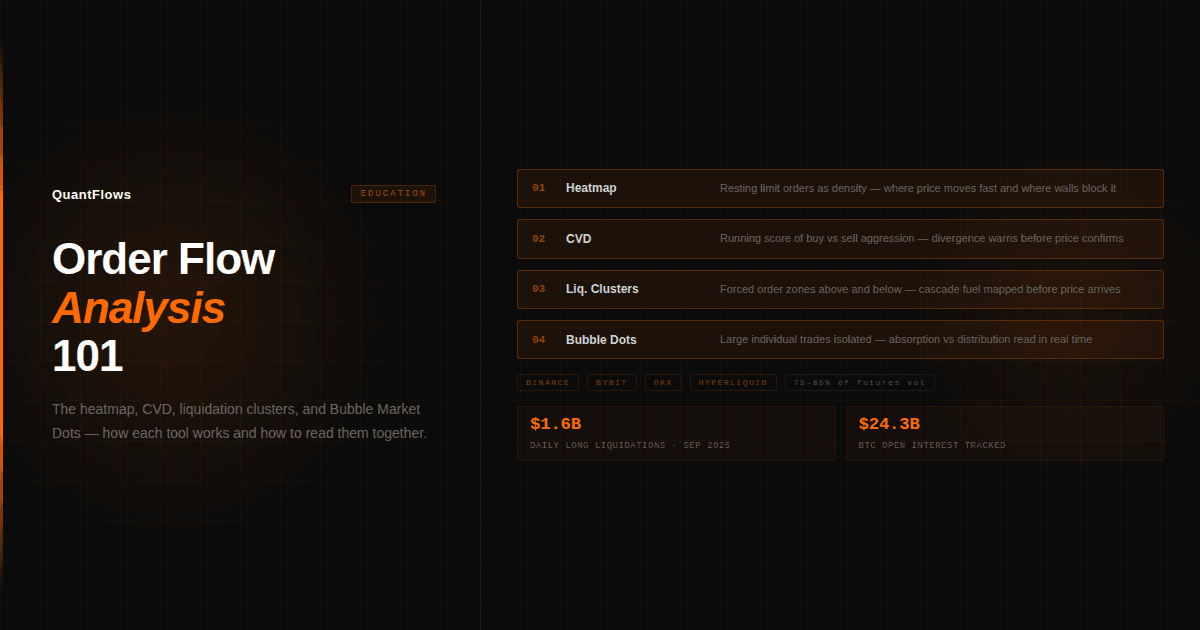
Order flow analysis shows what price charts hide — who's aggressive, where liquidity sits, and where forced orders hit. Learn to read the heatmap, CVD, and liquidation clusters.
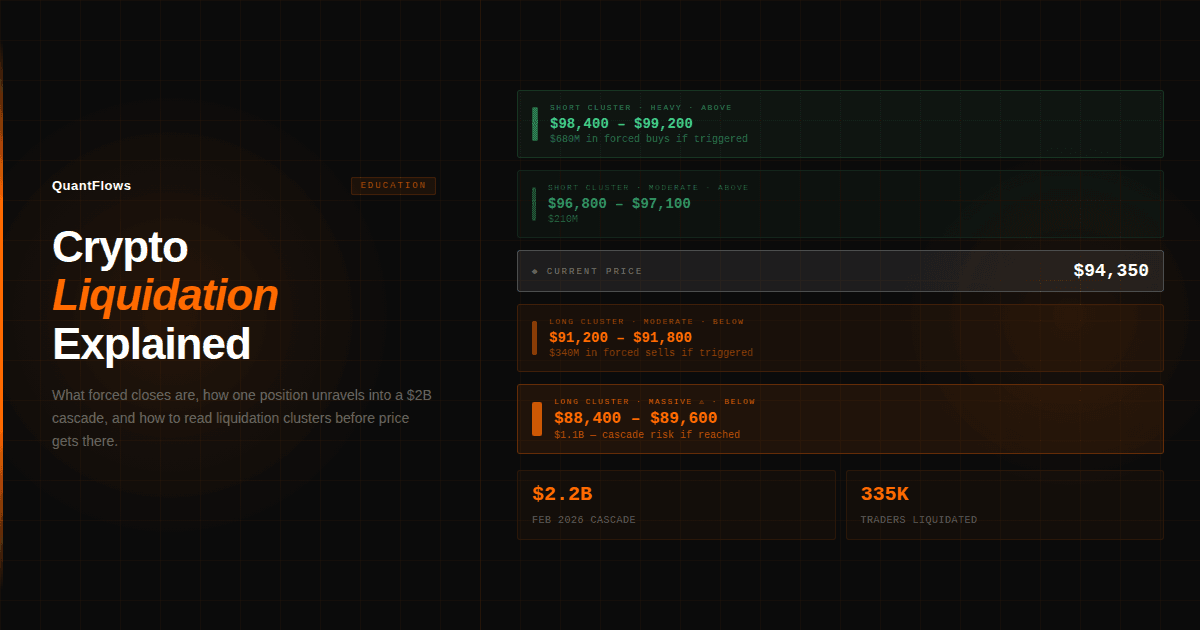
Crypto liquidation is the forced close that triggers cascades. Learn exactly how margin works, why $2B can vanish in hours, and how to read liquidation clusters.
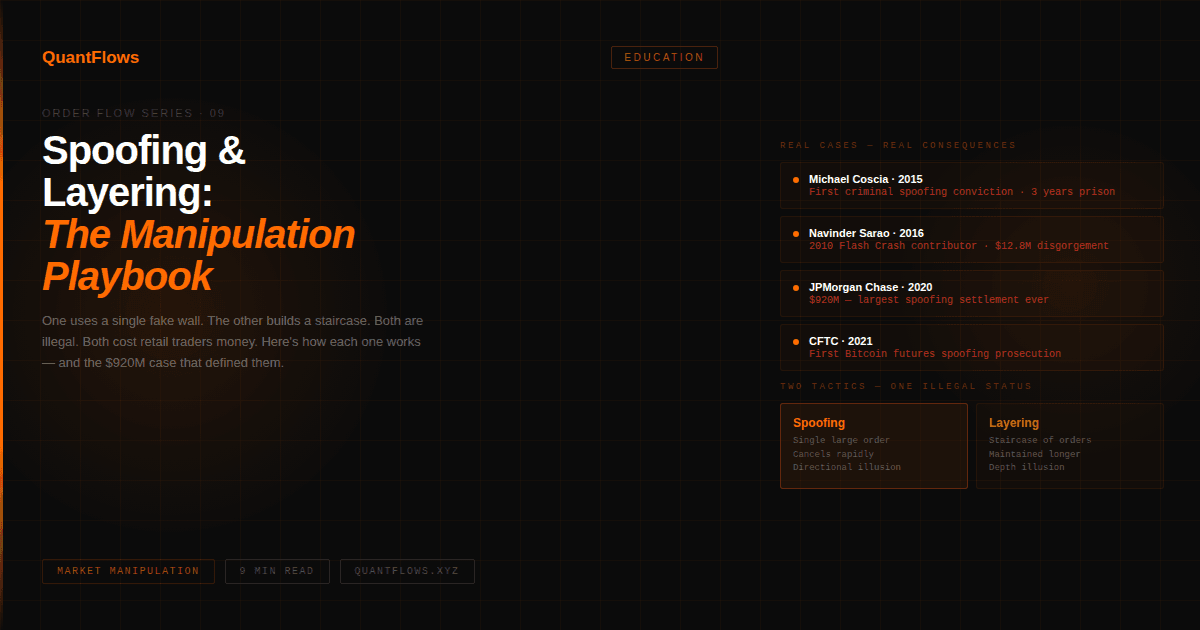
Spoofing and layering are the two most common forms of order book manipulation in futures markets. Here's exactly how each works, how they differ, and what they cost you.
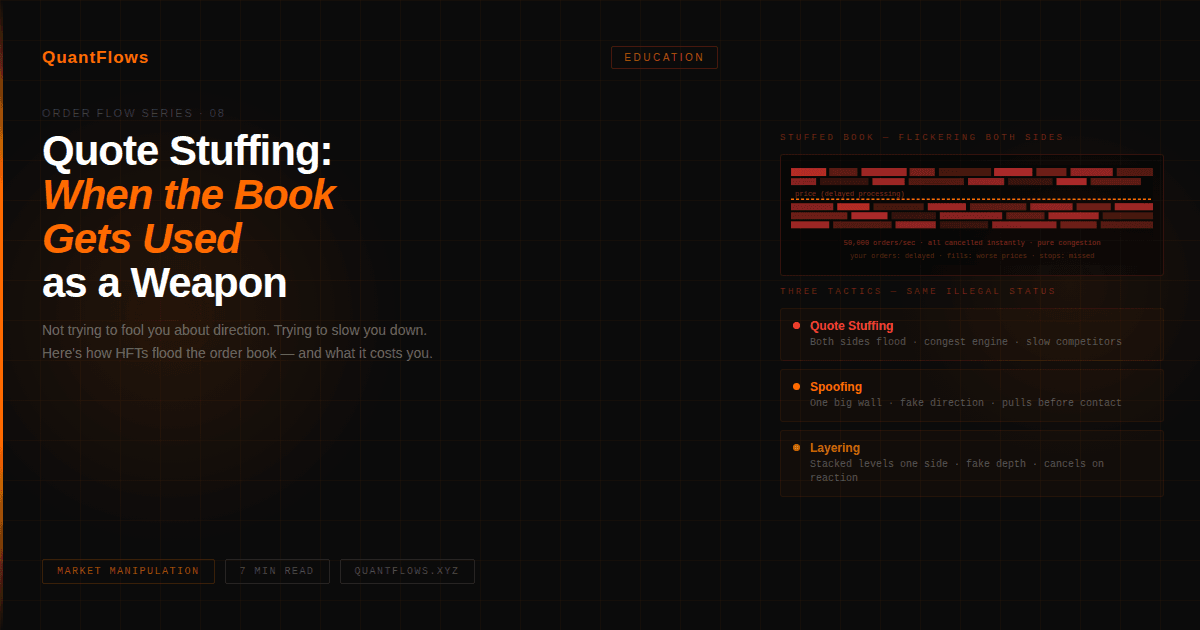
Quote stuffing floods the order book with thousands of fake orders per second to confuse and delay other traders. Here's how it works — and what it looks like on the heatmap.
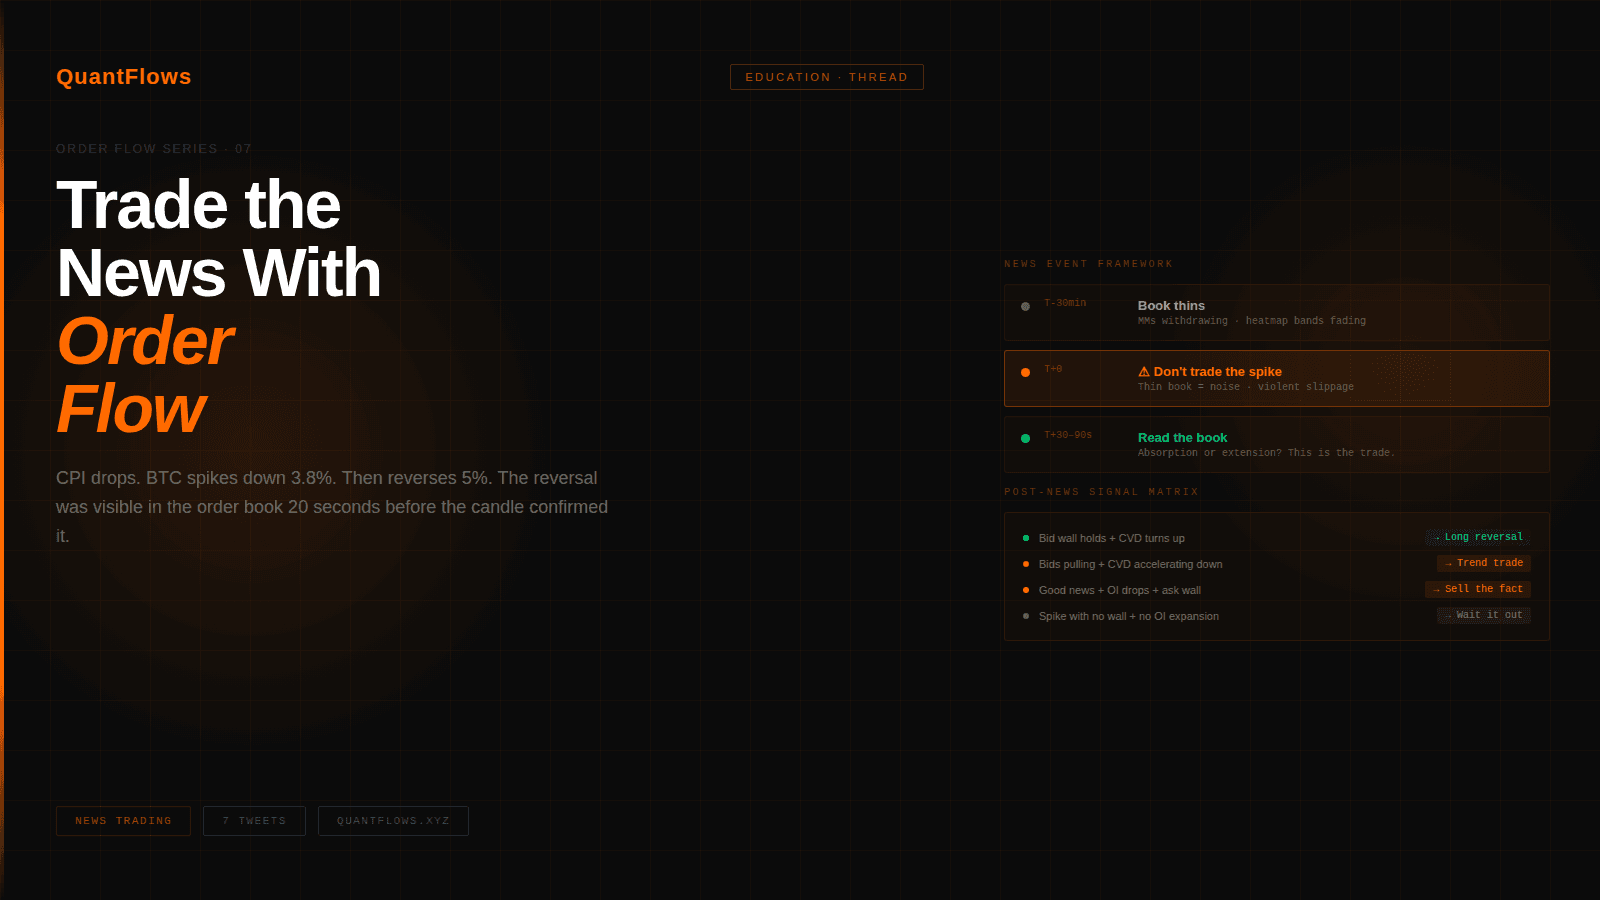
News moves markets — but the candle only shows the result. Here's how to read the order book before, during, and after a news event to trade it correctly.
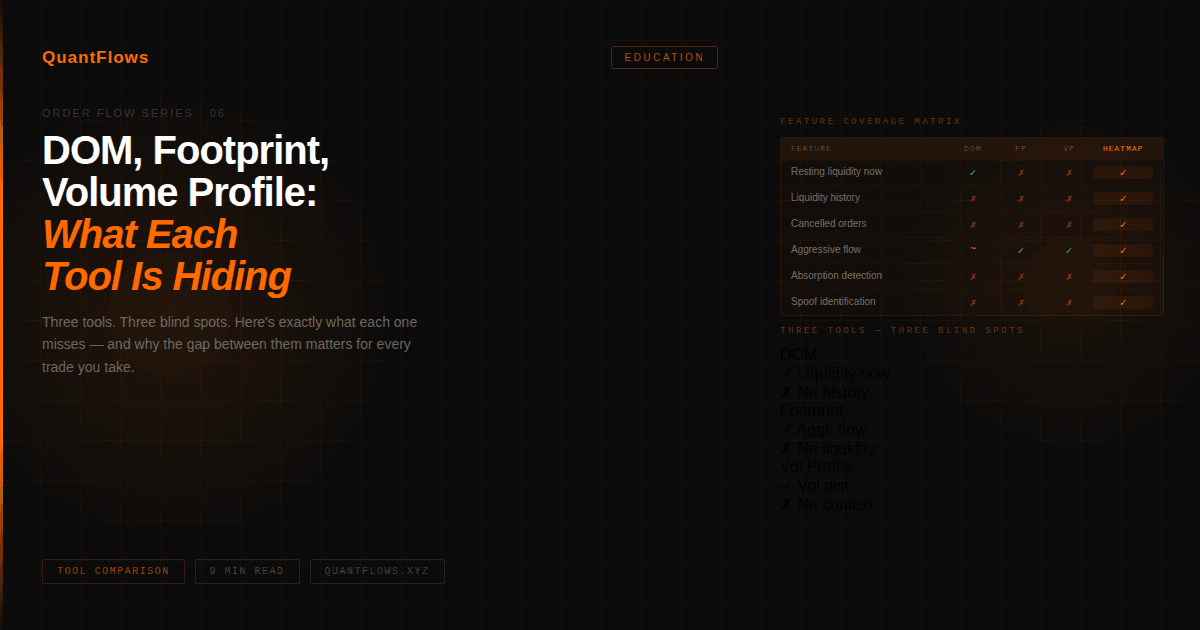
DOM, footprint charts, and Volume Profile each show a piece of the market. Learn what each tool misses and why the gap between them decides your trades.
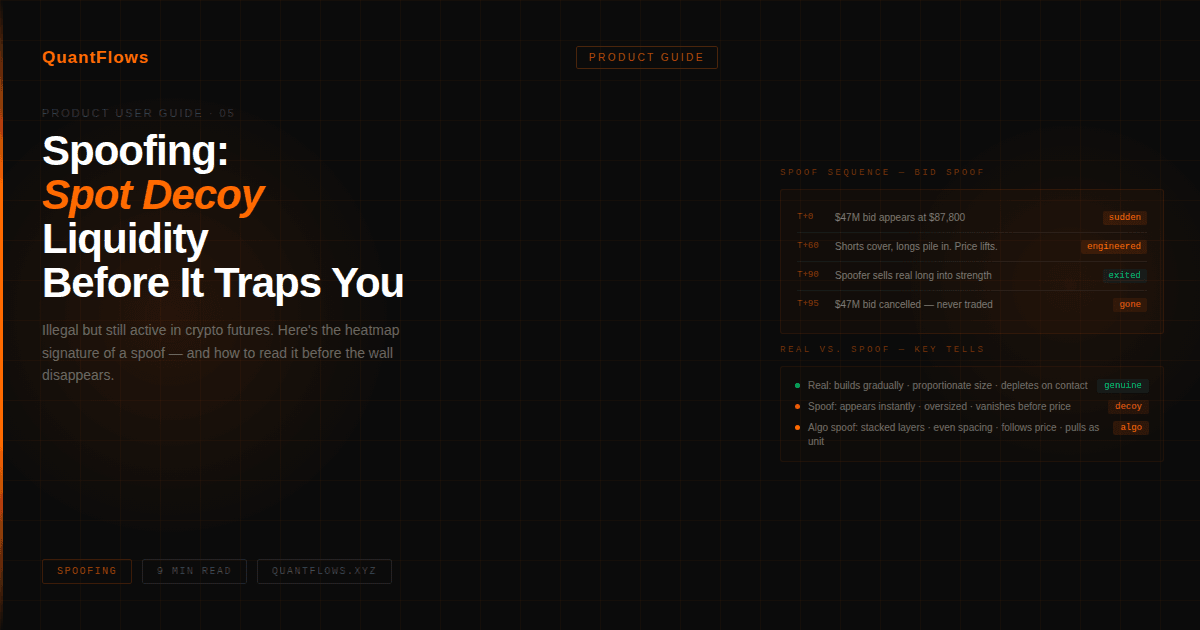
Spoofing is illegal — but it still happens in crypto futures. Here's how to identify decoy liquidity on the QuantFlows heatmap before it moves price against you.
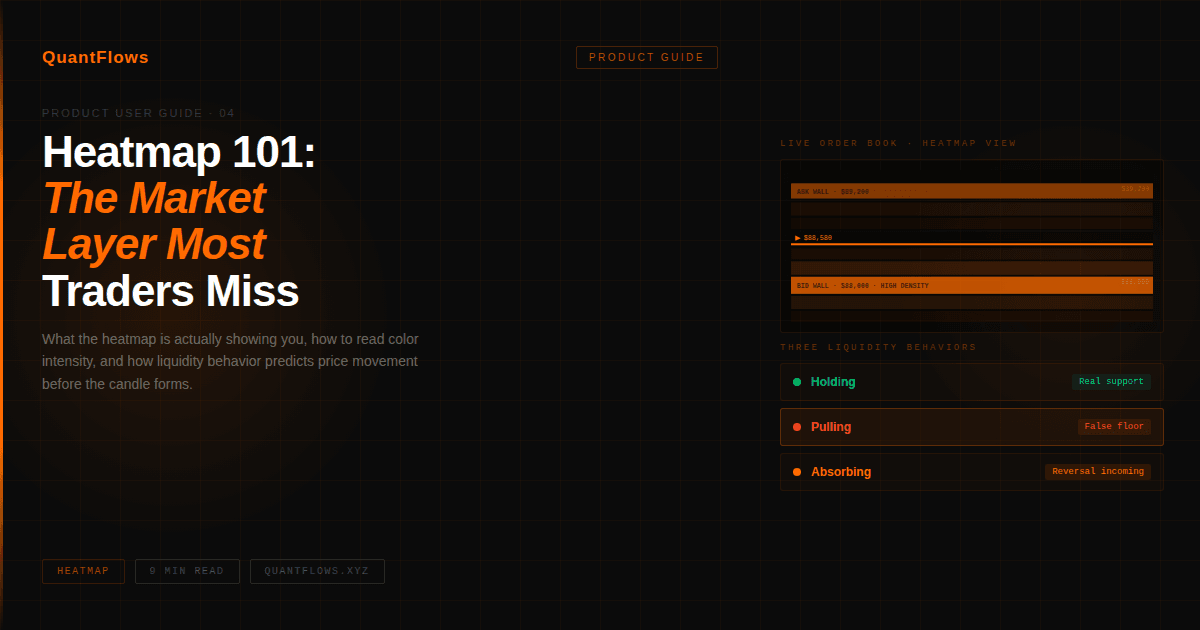
A complete guide to reading the QuantFlows heatmap — what color intensity means, how liquidity behaves, and how to use it to make better trade decisions.
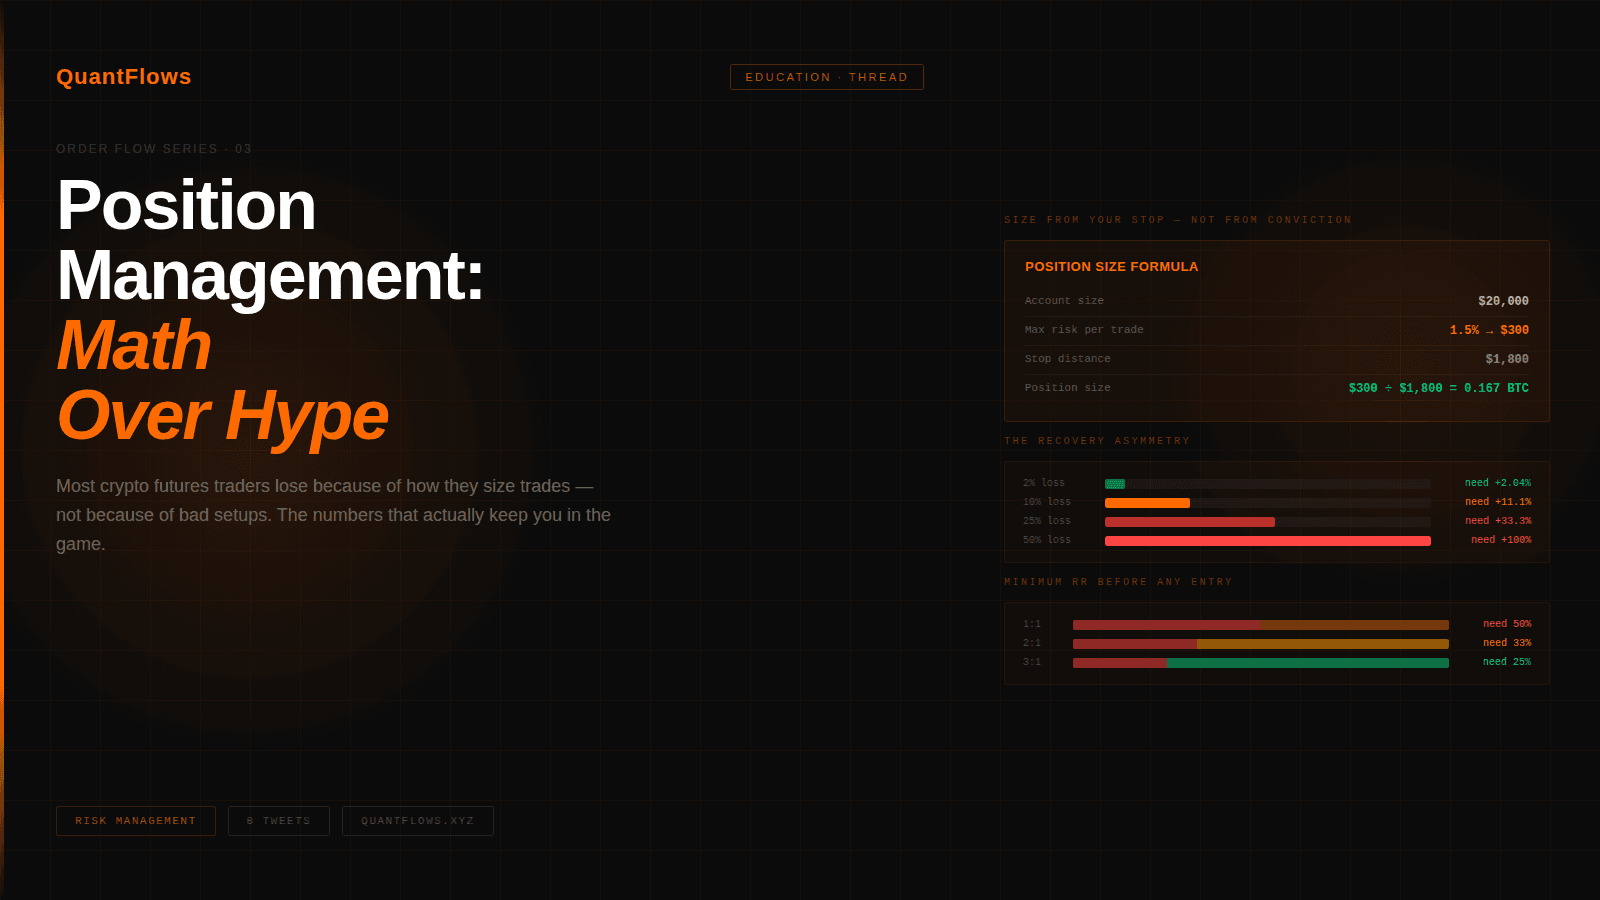
Most crypto futures traders lose because of how they size trades, not because of bad setups. The position management framework that actually matters — with real numbers.
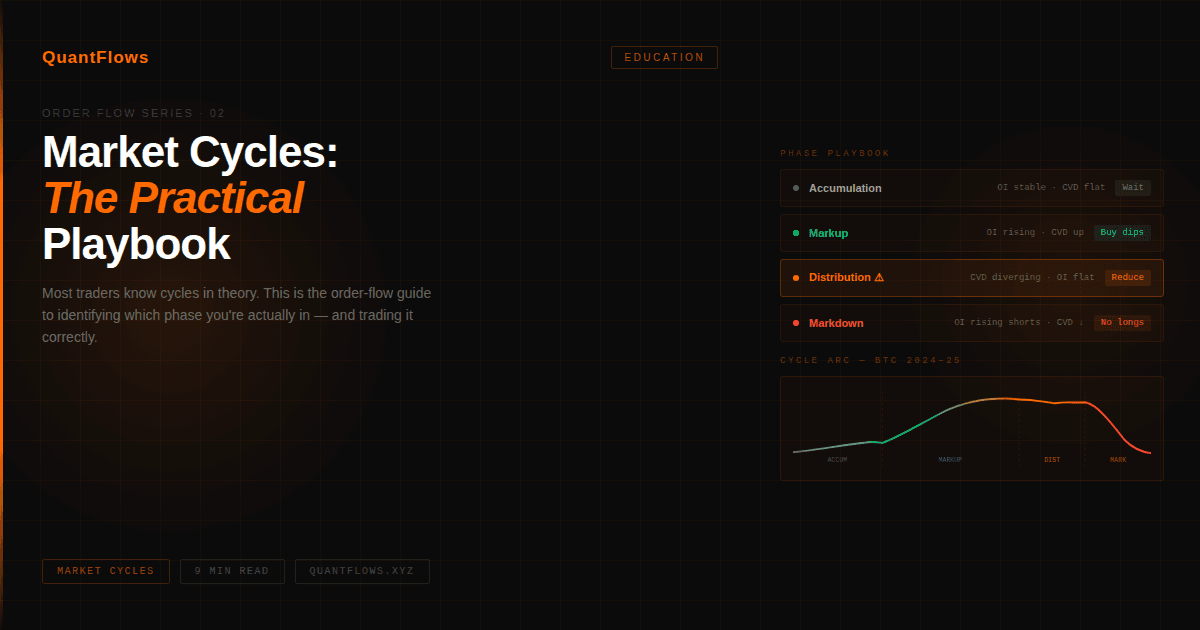
Most traders learn about market cycles in theory. This is the practical playbook — how to identify each phase in crypto futures and trade it correctly.
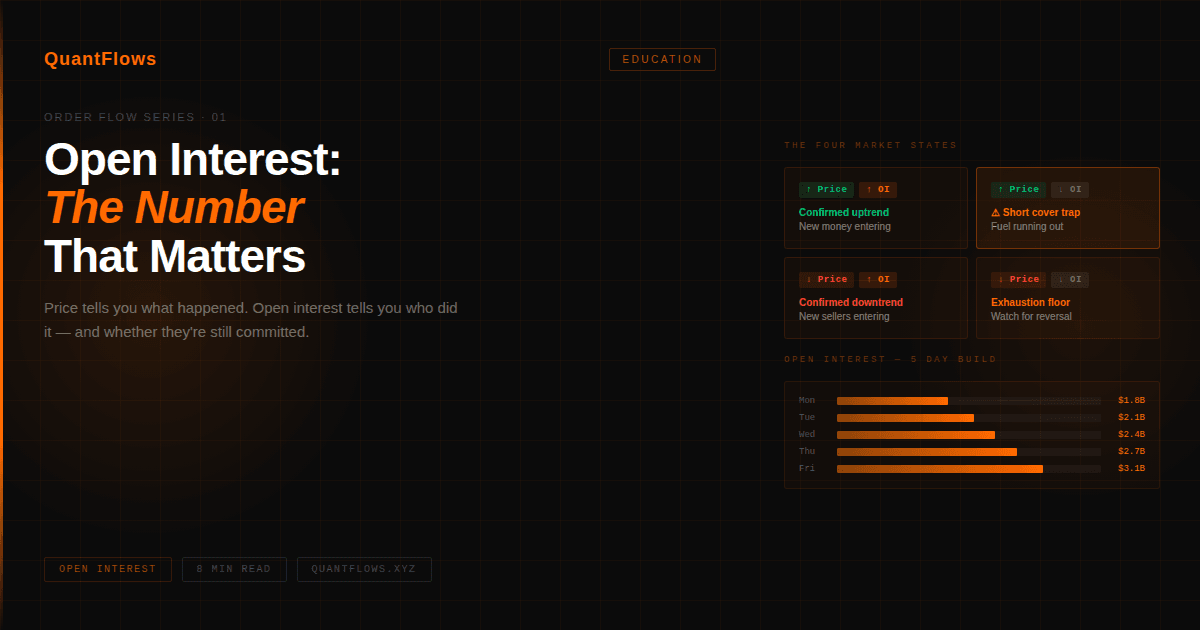
Open interest reveals whether price moves are backed by real conviction or just short covering. The one metric most crypto futures traders ignore — explained clearly.
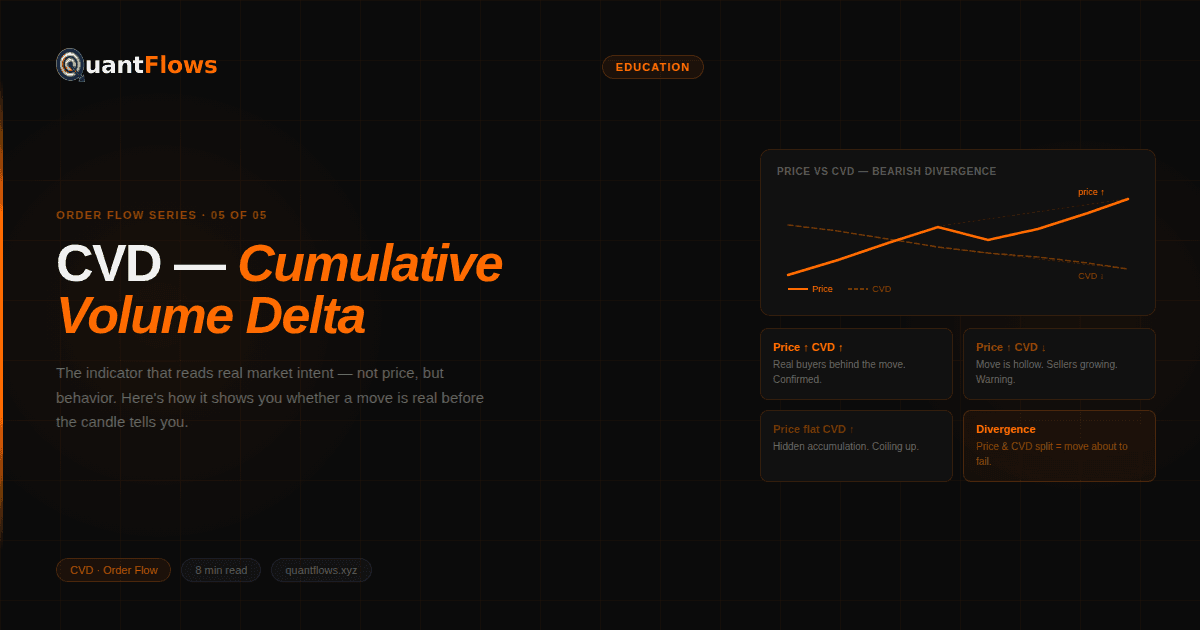
CVD (Cumulative Volume Delta) tracks the running difference between aggressive buying and selling volume. This guide explains exactly what it measures, how to read it, and why CVD divergence is one of the most reliable signals in order flow trading.
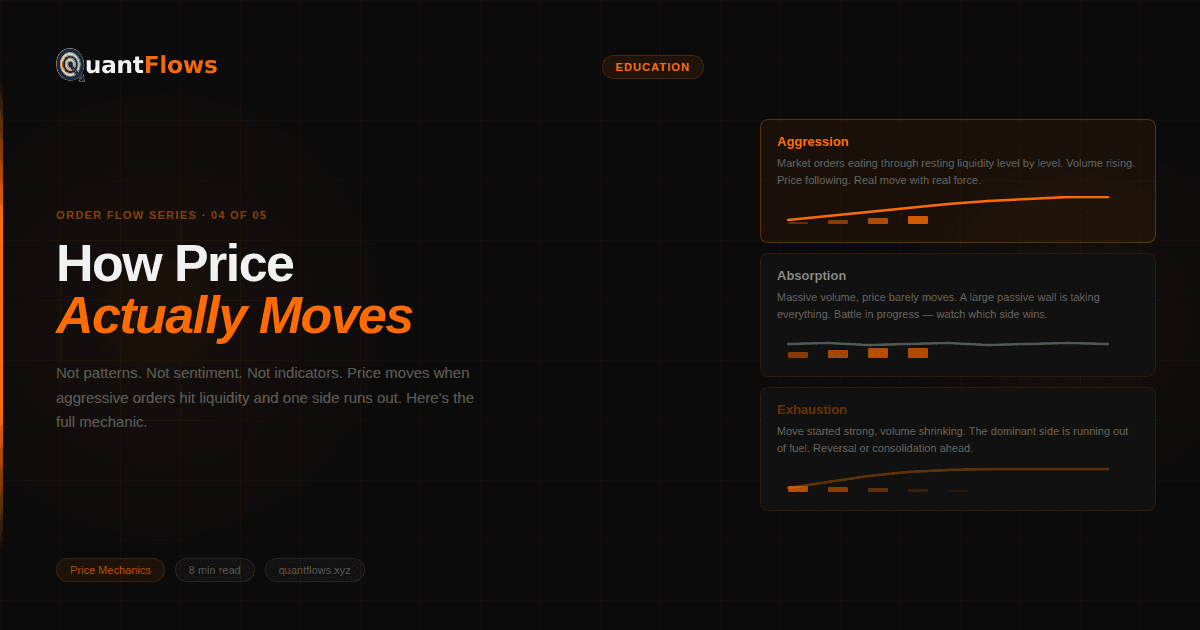
Price doesn't move because of chart patterns or indicators. It moves because of one mechanic: aggressive orders hitting passive liquidity. This guide explains exactly how — and what to look for before the move happens.
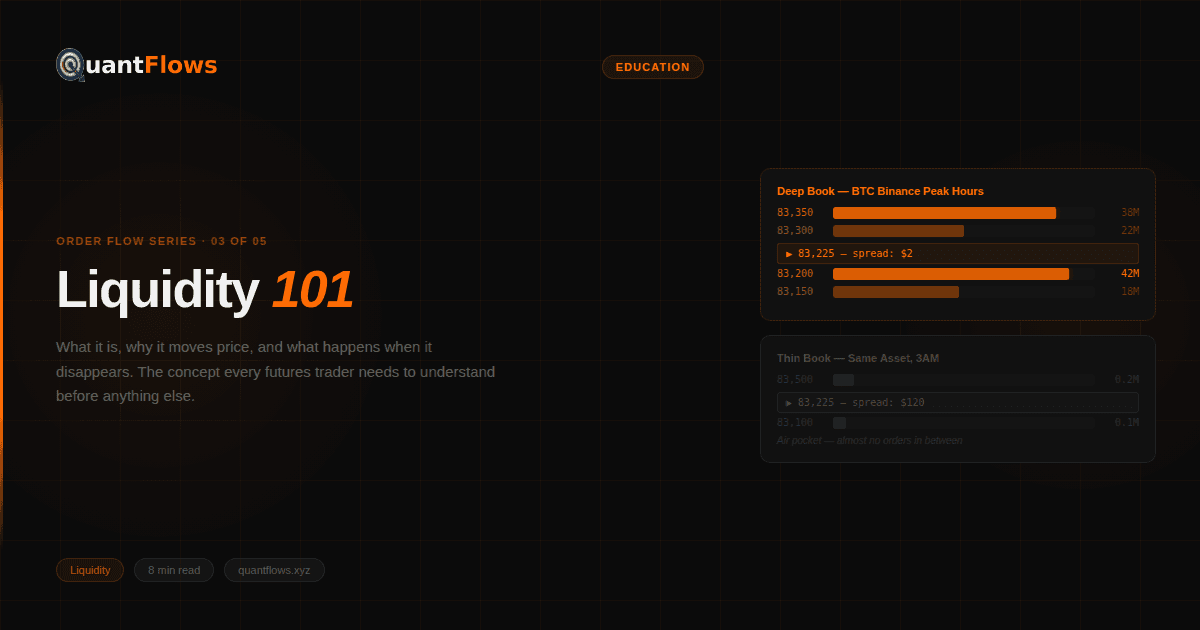
Liquidity is the single most important concept in crypto futures trading — and most traders don't really understand it. This guide explains what liquidity is, how it moves price, what happens when it disappears, and how to use it to enter trades smarter.
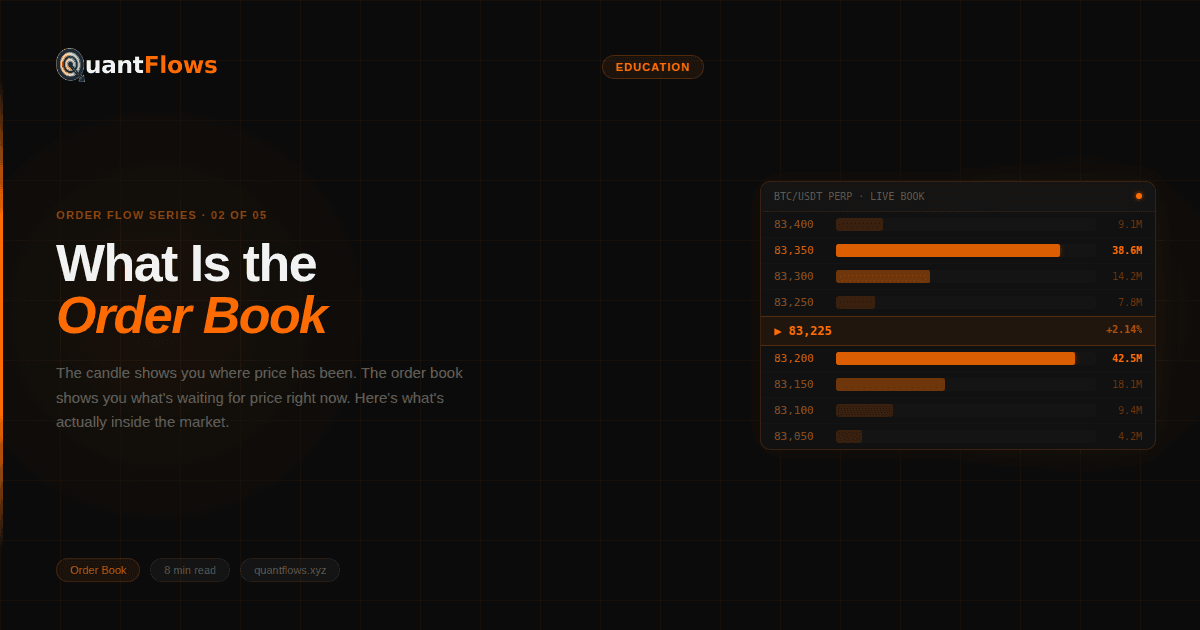
The order book is the actual market — not the candle chart. This guide explains exactly how it works, what bid/ask walls mean, and why reading it changes how you trade crypto futures.