Key Takeaways
- An iceberg order is a large limit order split into small visible tranches — the DOM shows 200 contracts while 8,000 sit hidden behind it.
- Three detection signals: price-volume divergence (CVD rising, price flat), DOM replenishment spikes (level resets to same size after each fill), and heatmap band persistence (fixed bright band that doesn't drift).
- CVD (Cumulative Volume Delta) is the primary confirmation tool — when aggressive volume is printing but price won't move, absorption is occurring.
- Diminishing replenishment size (200 → 140 → 90 lots) signals iceberg exhaustion — the move comes after the last tranche fills.
- QuantFlows aggregates heatmap depth, CVD, and Bubble Market Dots across Binance, Bybit, OKX, and Hyperliquid to surface absorption clusters in real time.
Price held $83,200 for eleven minutes. Aggressive market buys kept hitting the ask — 4,000 contracts of net delta — and the level didn't move a tick. What you were watching wasn't support. It was an iceberg.
Iceberg orders and hidden liquidity are why your setups sometimes feel front-run. Why price stalls at levels that look empty on the DOM. Why a breakout fires the moment you've given up waiting.
What Is an Iceberg Order in Trading?
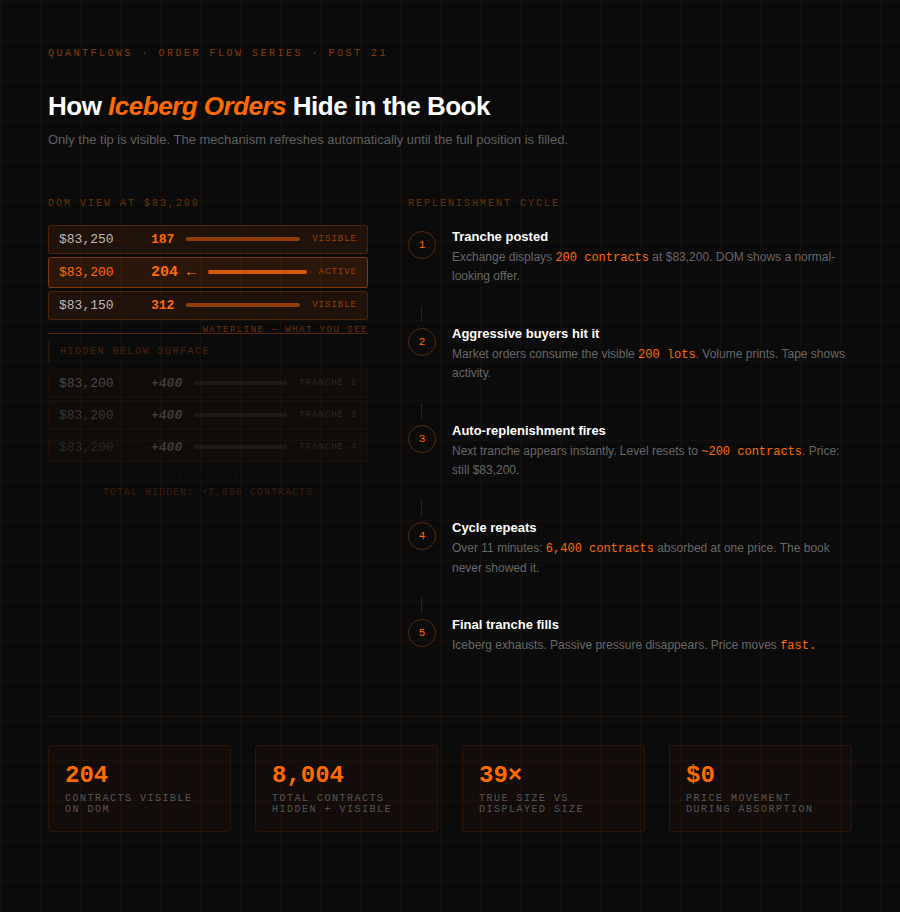
An iceberg order is a large limit order broken into smaller visible tranches. The exchange displays a fraction of the total size at a given price level. When that visible portion gets filled, the next tranche automatically replenishes. From the outside, the order book shows a normal-sized offer. The actual size sitting behind it — 10x, 20x, 50x the displayed quantity — never appears on the DOM.
The mechanics exist for a clear reason. An institutional desk executing a $40M BTC perp position can't post the full size. The moment that order hits the DOM, every participant reprices against it. Spreads widen. Front-runners load the opposite direction. The act of showing the order increases its cost dramatically. So they don't show it.
What makes this hard to detect is that the signature is subtle. The tell isn't in the order book — it's in the mismatch between what the order book shows and what the tape is actually printing. A 200-contract visible offer absorbing 4,000 contracts of aggressive buying over 8 minutes without price moving a tick: that's the fingerprint.
How to Detect Hidden Liquidity: Three Signals
Hidden doesn't mean invisible. Iceberg orders leave three distinct traces in market data — each readable in real time.
- Price-volume divergence is the most direct signal. When aggressive market orders hit a level — real buying pressure reflected in a rising CVD (Cumulative Volume Delta) — but price fails to move through it, something is absorbing that pressure. The volume is executing. The tape is active. Price isn't moving. That divergence is the iceberg doing its job.
- Replenishment spikes are the mechanical tell. Each time a visible tranche fills, the next appears. On Level 2 data, a level continuously resets to approximately the same displayed size. The ask sits at 200 contracts. It fills. It's back to 200. It fills again. Over several minutes, thousands of contracts have traded through that level while the display never drops below ~180. That reset pattern is impossible in a normal order book.
- Heatmap persistence shows structural intent. On an order flow heatmap, a normal limit order traces a diagonal streak — it moves with market makers adjusting quotes. A hidden accumulation zone doesn't move. It shows as a persistent bright band at a fixed price level, sitting there across dozens of bars while price oscillates around it.
![Three-panel diagram showing CVD divergence signal, DOM replenishment spike pattern, and persistent heatmap band]](https://cdn.sanity.io/images/6jgu85ip/production/d975bc56238b07bda5f09cd2fbbc2bd642a7e421-900x687.png)
Why CVD Confirms What the DOM Can't Show
None of the three signals work in isolation. The confirming layer is absorption — and absorption requires CVD.
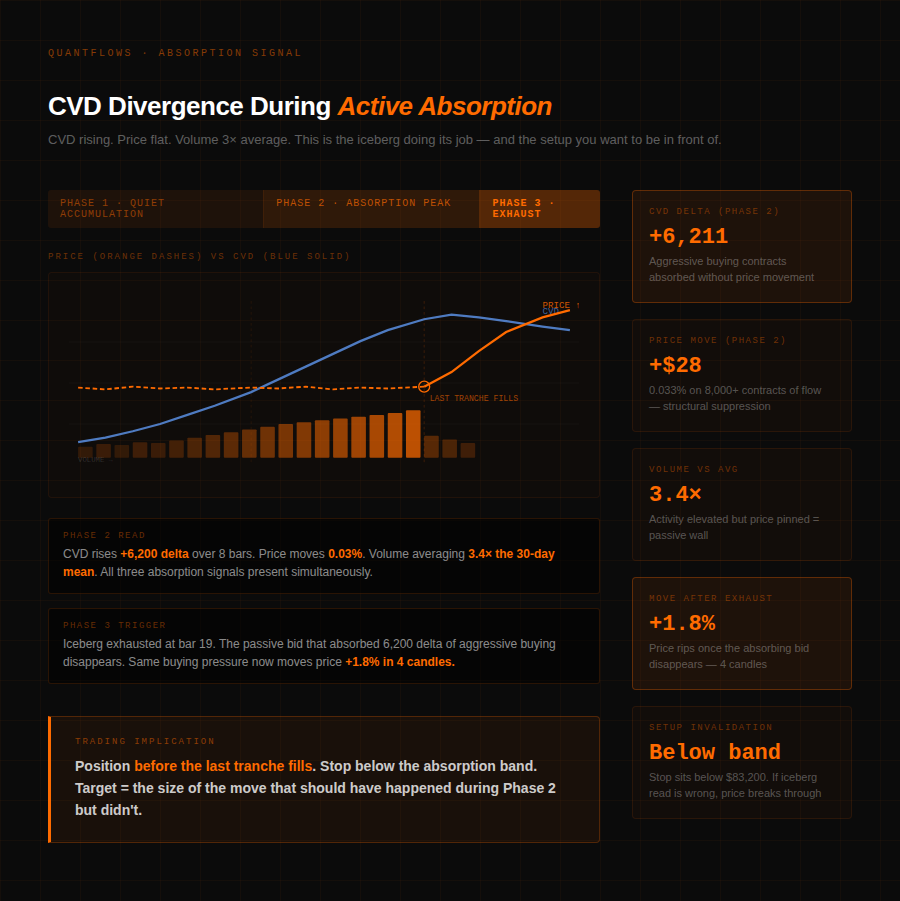
CVD (Cumulative Volume Delta) tracks the net difference between aggressive buying and aggressive selling. When CVD trends strongly in one direction but price refuses to follow, absorption is occurring. A large passive limit order is eating the aggressive flow, tranche by tranche, without giving ground.
The setup reads like this: CVD climbs steadily for 6 bars. Price stays flat at the ask. Volume on each bar is 2–3x the recent average. The heatmap shows a bright fixed band at that ask level. That's not coincidence. That's institutional accumulation using iceberg orders to avoid moving price against themselves.
The practical consequence: when that hidden bid eventually gets fully filled, the passive pressure disappears. Aggressive buying now has nothing absorbing it. Price moves — fast. The entry is before the last tranche fills, not after the candle prints.
The Exhaustion Signal: Diminishing Replenishment
As the iceberg approaches completion, each replenishment comes back slightly smaller. The visible order that reset to 200 contracts for 20 minutes starts resetting to 180, then 140, then 90. That diminishing replenishment is the iceberg approaching its final tranche.
When the last tranche fills, two things happen simultaneously. The passive buy pressure that absorbed the selling disappears. And every short that held through the absorption, expecting breakdown, is now immediately wrong. Their stops — sitting just below the support — are clustered and reachable. Price sweeps them in seconds. The move feeds itself.
This is the stop run sequence: accumulation → absorption → exhaustion → trigger → squeeze. CVD tells you which phase you're in before price confirms it. The full mechanics of how that sequence plays out — including how to distinguish a genuine reversal from a fake support sweep — are covered in the stop runs and CVD absorption guide.
How QuantFlows Surfaces What the Book Hides
Reading iceberg orders manually across four exchanges in a live market isn't realistic. QuantFlows aggregates order book depth and CVD across Binance, Bybit, OKX, and Hyperliquid in a single view — you're not monitoring four separate charts hoping to catch the signal on each.
The heatmap makes persistent zones visible as color-coded bands that don't move with normal quote flow. When a level stays bright across multiple timeframes while CVD and volume data show active pressure against it, the platform surfaces that as an absorption cluster. The Bubble Market Dots layer marks points where executed volume is anomalously large relative to the price movement it produced — the mechanical signature of an iceberg absorbing aggressive orders. Common misreads of these heatmap bands — including ghost walls and stale data errors — are covered in the heatmap trading mistakes guide.
According to the Princeton GEO study on order flow mechanics, institutional participants consistently use hidden order types to minimize market impact, making detection tools that aggregate across venues significantly more reliable than single-exchange reads. Spotting a hidden 8,000-contract bid at $83,200 changes your entry, your stop placement, and your conviction in the trade — before the market reveals the level publicly.
What Changes When You Can Read the Hidden Book
Most retail traders run a one-layer read: price and visible order book. That read has a systematic blind spot wherever institutional order flow is active — which is exactly where the significant moves originate.
Adding hidden liquidity detection doesn't require predicting intent. You don't need to know why the whale is accumulating. You need to know where they're defending and how much has been absorbed. When the absorption level exhausts, you have a clean directional trade with a well-defined invalidation. When price approaches a persistent heatmap band with rising CVD, you have a reason to lean against the move.
The market isn't transparent. But it isn't perfectly opaque either. Iceberg orders create detectable friction at exactly the levels that matter most.
Frequently Asked Questions
- What is an iceberg order in crypto futures? An iceberg order is a large limit order split into small visible tranches on the order book. The exchange displays only a fraction of the total size — typically 200–500 contracts — while the remaining position (often 10–50x larger) automatically replenishes after each fill. Traders use them to avoid showing their full position and moving the market against themselves.
- How do you detect iceberg orders on a heatmap? Look for a persistent bright horizontal band at a fixed price level that doesn't drift with market maker quote adjustments. Unlike normal limit orders that trace diagonal streaks as prices move, an active iceberg stays fixed. Confirm with DOM replenishment patterns (level resets to same size after each fill) and CVD divergence (aggressive volume printing without price movement).
- What is CVD and why does it matter for iceberg detection? CVD (Cumulative Volume Delta) is the running net difference between aggressive buy volume and aggressive sell volume. When CVD rises while price stays flat, a large passive order is absorbing the aggressive flow — the core iceberg absorption signal. CVD divergence from price is the most reliable real-time tell that hidden size is on the other side of the market.
- What does diminishing replenishment mean? As an iceberg order nears complete execution, each visible tranche that replenishes comes back smaller than the last — 200 contracts becomes 180, then 140, then 90. This shrinking reset size signals the iceberg is approaching its final tranche. The move typically comes within seconds of the last tranche filling.
- Why does QuantFlows show data from multiple exchanges? BTC perpetual futures trade simultaneously across Binance, Bybit, OKX, and Hyperliquid with different order book depths on each. A persistent absorption cluster appearing on all four exchanges simultaneously is structurally different — and significantly more reliable — than a signal appearing on one exchange alone. QuantFlows aggregates all four into a single view so cross-exchange confirmation is visible in real time.
- Can iceberg orders be used for both buys and sells? Yes. A passive bid iceberg absorbs aggressive selling and precedes upside moves. A passive offer iceberg absorbs aggressive buying and precedes downside moves or extended consolidation. CVD direction tells you which side the iceberg is on: CVD rising with flat price = passive sell absorption (bullish). CVD falling with flat price = passive buy absorption (bearish).
QuantFlows visualizes multi-exchange order book depth, CVD, and absorption clusters in real time. Free during beta at quantflows.xyz.