In early October 2025, ETH order book depth at 1% from mid-price sat just above $8 million. By early November it had dropped to under $6 million — a 25% collapse in the liquidity cushion absorbing normal-sized trades. The candles looked unremarkable.
Spreads barely widened. But under the surface, the book was structurally thinner. Trades that previously moved price 20 basis points were moving it 35. Stops that would have survived a routine pullback were getting swept. The market hadn't changed direction — it had changed texture.
Order book depth is that texture. It's not a signal in the traditional sense. It's the medium through which every signal plays out, and ignoring it means trading on price without understanding what price is actually resting on.
What Order Book Depth Means in Practice
Order book depth is the volume of resting limit orders stacked at every price level beyond the best bid and ask. The best bid and best ask are the top of the book — the tightest prices available. Everything below the best bid and above the best ask is depth: the layers of passive buy and sell interest waiting at progressively worse prices.
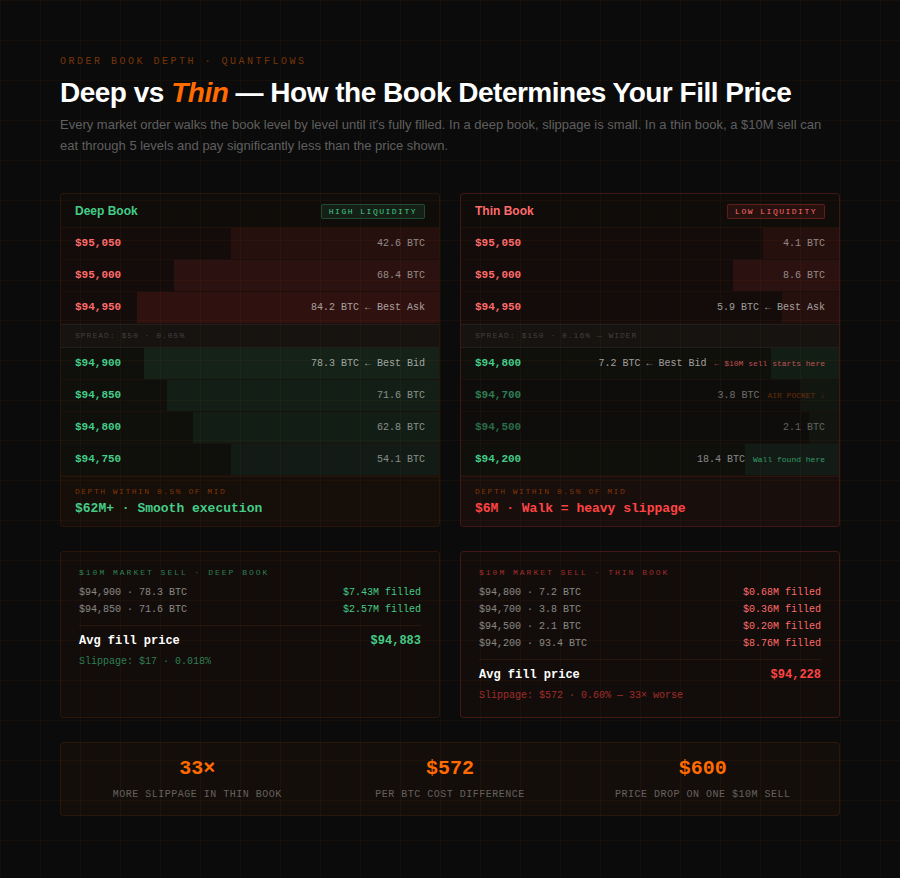
When a market order hits the book, it consumes the best available price first. If the order is larger than what's resting there, it moves to the next level, then the next. That process — "walking the book" — is how a single large trade generates slippage. A $10M market sell on BTC doesn't fill at one price.
It fills across whatever bids exist at $94,800, $94,750, $94,700, and further down, depending on how much size is resting at each level. The average fill price is worse than the price the trader clicked.
QuantFlows renders depth live across Binance, Bybit, OKX, and Hyperliquid in the heatmap. Bright zones mark where large concentrations of resting orders sit. Thin zones between them are where the book has gaps — where a moderate-sized market order can punch through multiple price levels in milliseconds with almost nothing absorbing it. Those thin zones matter as much as the walls.
Walls, Gaps, and Why Price Moves the Way It Does
A deep order book doesn't mean uniform depth across all levels. In practice the book is uneven — dense at certain prices, thin in between. Two structures define how price behaves: walls and air pockets.
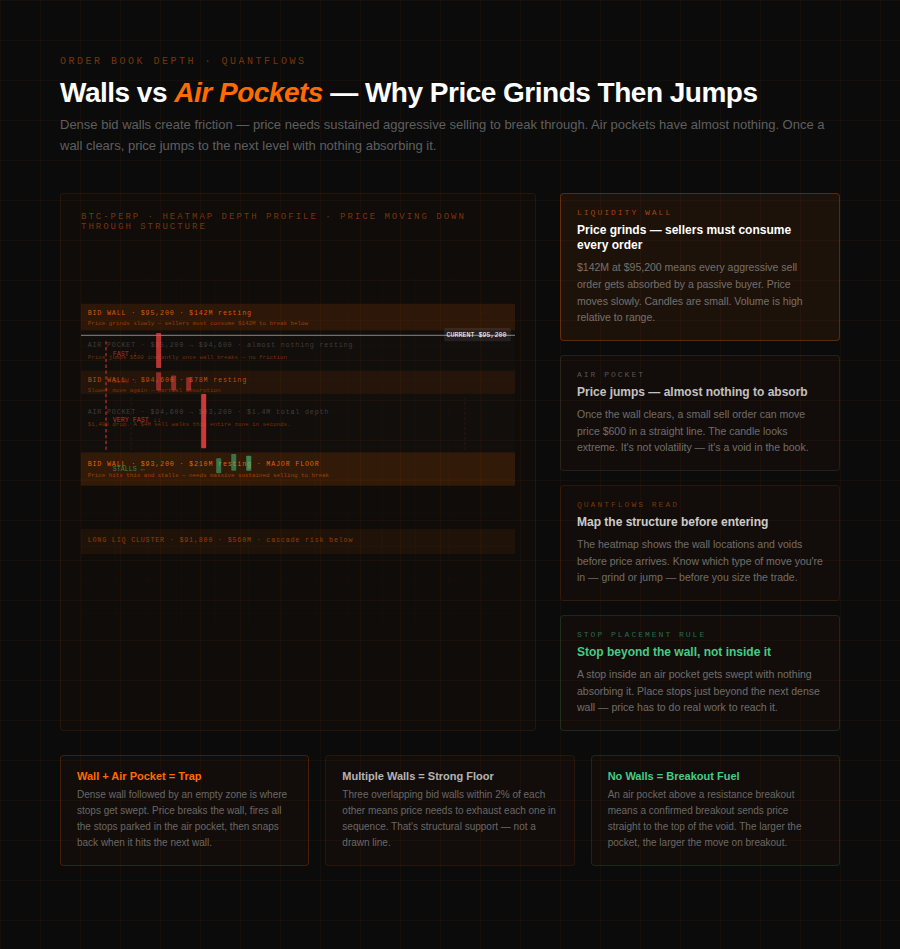
A liquidity wall is a large concentration of resting limit orders at a specific price. On the bid side, a $120M wall at $93,000 means any market sell order has to exhaust $120M before price can trade below $93,000. That's not a support level in the traditional sense — it's a literal wall of orders that market sells must consume before price can move through. The heatmap in QuantFlows shows this as a bright horizontal band. The brighter it is, the more resting liquidity is there, and the harder price has to work to breach it.
An air pocket is the opposite: a stretch of price levels with almost nothing resting in the book. When a market order exhausts the last wall and hits an air pocket, there's no resistance. Price doesn't slow down — it jumps. A 3% air pocket above a breakout level means a breakout through that level sends price straight to the top of the pocket with almost nothing in between. Every futures trader has seen a candle that looks improbably large for the conditions. Nine times out of ten, there was an air pocket in the book.
The combination of walls and air pockets creates the uneven, often non-linear price movement that makes crypto futures hard to trade on candles alone. Price grinds slowly through walls and jumps through air. QuantFlows heatmap makes the layout of both visible before price arrives.
How Depth Changes — And What That Change Signals
Order book depth is not static. It shifts throughout the trading session, responding to market maker activity, news flow, funding timestamps, and volatility conditions.
The October 2025 data makes this concrete: heavy ETF outflows and shifting Fed rate expectations caused market makers to pull back their resting orders across major CEXs, leaving BTC and ETH books structurally thinner for weeks. The price action looked normal. The execution conditions were not.
Three situations reliably thin the book:
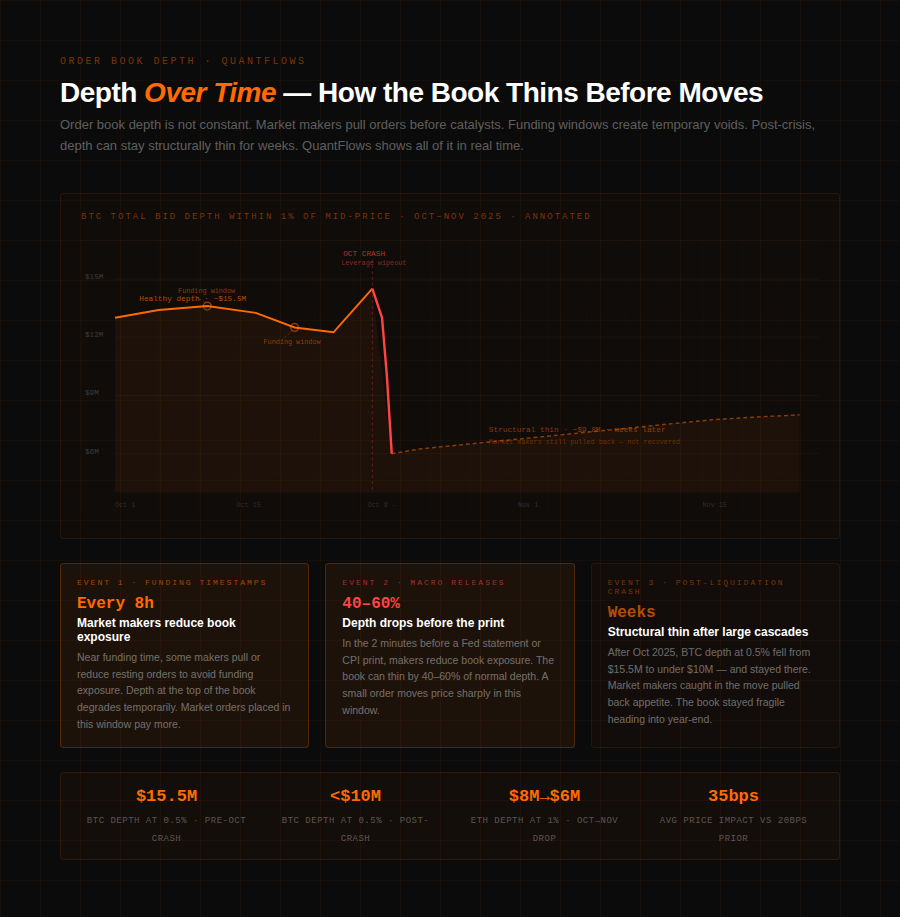
Around funding timestamps on perpetual futures, some market makers pull or reduce their resting orders to avoid funding exposure. Spreads widen briefly and depth at the top of the book degrades. A market order placed in this window faces worse execution than the same order placed five minutes earlier.
During macro data releases — Fed statements, CPI prints, payroll data — market makers reduce book exposure before the number drops. The book can thin by 40–60% in the two minutes before a scheduled release, then rebuild rapidly after. In the thin window, price can move sharply on surprisingly small order flow. QuantFlows shows this as the heatmap zones lightening up across all four exchanges simultaneously before a catalyst.
After large liquidation cascades, market makers who got caught on the wrong side of a rapid move also pull back. After October 2025's leverage wipeout, order book depth across major centralized exchanges remained structurally lower for weeks, with market-maker appetite suppressed by the losses.
This left crypto markets thinner and more fragile heading into year-end — the kind of condition where a routine $20M trade can generate outsized price impact.
Depth as a Trading Tool in QuantFlows
The practical applications of order book depth data go beyond identifying walls and air pockets before entries. Three specific uses show up in day trading workflow:
Stop placement. A stop-loss placed inside a thin zone will be swept more easily than one placed just beyond a dense bid wall. If a $90M bid wall sits at $93,200 and your stop is at $93,100, you're placing your exit inside the wall — price would have to exhaust $90M of resting bids to reach it.
That's a structurally sound stop location. A stop at $92,800, in a thin zone below the wall, is far more exposed to a sweep-and-reverse scenario where price dips through the thin zone, triggers your stop, and immediately rebounds once it hits the next wall below.
Position sizing. During busy or news-driven moments, large market orders can widen spreads and raise slippage significantly. Before sizing into a trade, checking depth tells you how much your entry will cost. A $5M position in a BTC book with $50M of depth within 0.5% of mid will fill cleanly. The same $5M in a book with $8M of depth in that range walks the book noticeably, paying more than intended for every contract.
Breakout timing. A breakout through a large ask wall has different meaning than a breakout through an air pocket. Breaking through a $150M wall requires sustained, conviction-backed aggressive buying — the breakout is earned and tends to be more durable.
Breaking through an air pocket requires almost nothing, happens fast, and can reverse just as quickly once the pocket clears. QuantFlows shows which type of breakout is unfolding in real time — the heatmap either shows the wall thinning from sustained buying, or it shows nothing between current price and the next wall, which explains the vertical move without explaining sustained demand.
Depth data won't tell you where price goes. It tells you what it will take to get there, what the move will cost in execution, and whether the structure of the book supports or undermines what the candle appears to be saying.
QuantFlows renders live order book depth as a heatmap across Binance, Bybit, OKX, and Hyperliquid — alongside CVD, liquidation clusters, and Bubble Market Dots. Free during beta at quantflows.xyz.