Key Takeaways
- Order flow terms form a system, not a vocabulary list: iceberg → absorption → CVD divergence → Bubble Dot → entry → stop below HVN → target at LVN.
- CVD (Cumulative Volume Delta) has four states — two aligned with trend and two divergent — and the divergent states are where stop runs and reversals are born.
- Ghost walls and iceberg orders look identical on the DOM but are completely different — one is real size being hidden, the other is a fake order with zero intent to execute.
- Liquidity magnets (dense stop clusters) and liquidity vacuums (thin zones) predict where price gravitates and where it accelerates.
- QuantFlows is a real-time order flow analytics platform that aggregates heatmap, CVD, and liquidation data across Binance, Bybit, OKX, and Hyperliquid simultaneously.
Most trading glossaries define absorption as "when large orders absorb market orders." Technically accurate. Useless in practice. The definitions don't tell you what absorption looks like at 2 AM when BTC is testing a level and your position is moving against you.
Every term below is defined the way it appears in a live market — what it looks like on the heatmap, what it means in context, and why it changes how you trade. QuantFlows is a real-time order flow analytics platform that aggregates heatmap, CVD, and liquidation data across Binance, Bybit, OKX, and Hyperliquid simultaneously. These are the terms that platform is built around.
What Is Absorption in Order Flow Trading?
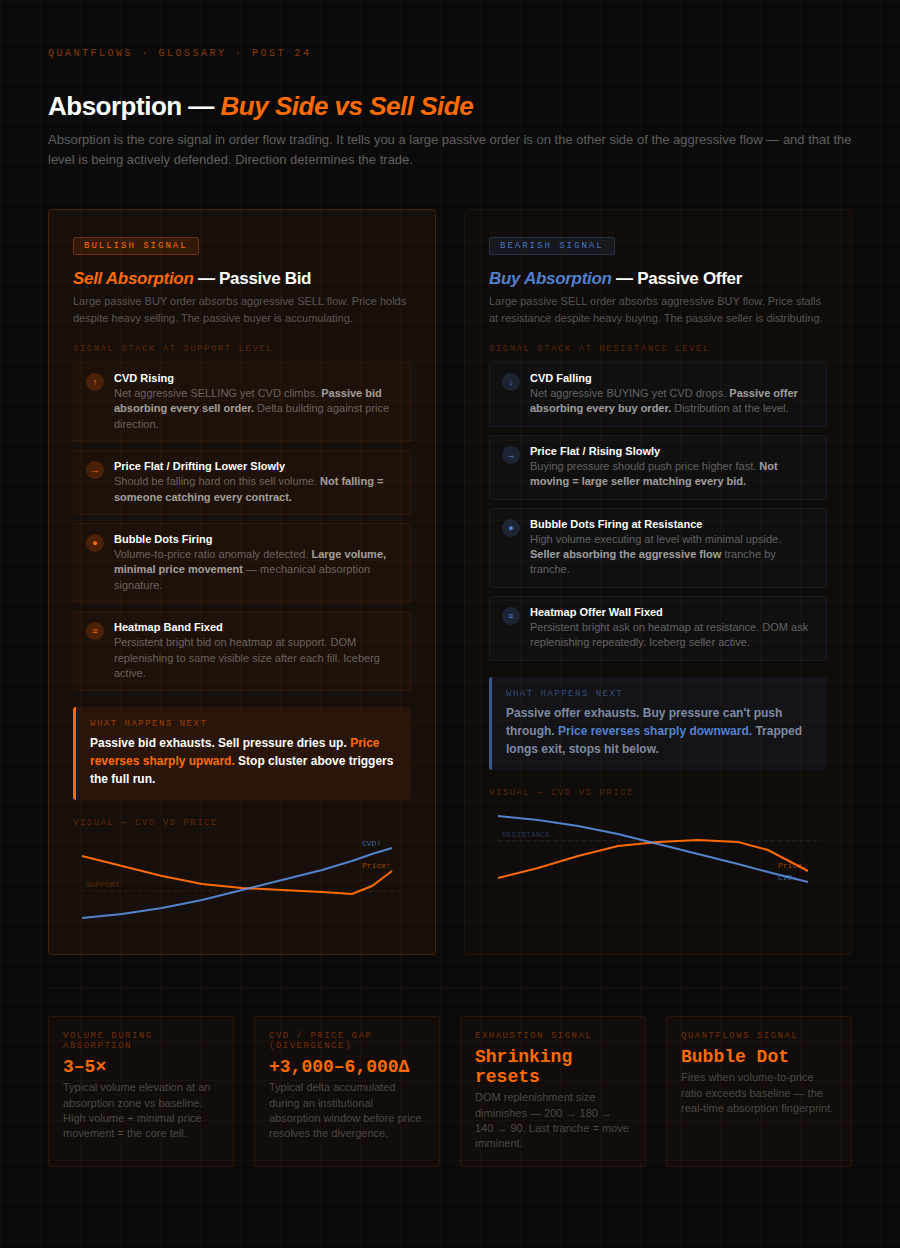
Absorption is when a large passive limit order eats aggressive market flow without letting price move. A trader hammers the ask with 3,000 contracts of market buys. Price moves $12. That's absorption — the passive sell wall took the other side of every contract without giving ground.
Absorption is the core signal in order flow trading. It means someone with serious size has decided a price level is worth defending. On QuantFlows, absorption shows up as the combination of a rising CVD and stationary price — the market is buying aggressively, but something is eating it. Bubble Market Dots fire at the absorption cluster when the volume-to-price ratio becomes anomalous. For the full absorption detection framework, see the how price actually moves guide.
The direction matters. Sell absorption (large passive bid eating aggressive selling) precedes upside moves. Buy absorption (large passive offer eating aggressive buying) precedes downside moves or consolidation.
Aggressor Volume
Aggressor volume is volume executed by market orders that cross the spread and take liquidity immediately. The running net balance between aggressive buy and aggressive sell volume is CVD.
What Is a Book Sweep?
A book sweep is a large market order that consumes every available limit order at a price level and pushes price to the next. On the QuantFlows heatmap, it appears as a rapid burn through a liquidity zone — the bright band disappears as price blows through in seconds. Book sweeps move price. Absorption holds it.
What Is CVD in Trading?
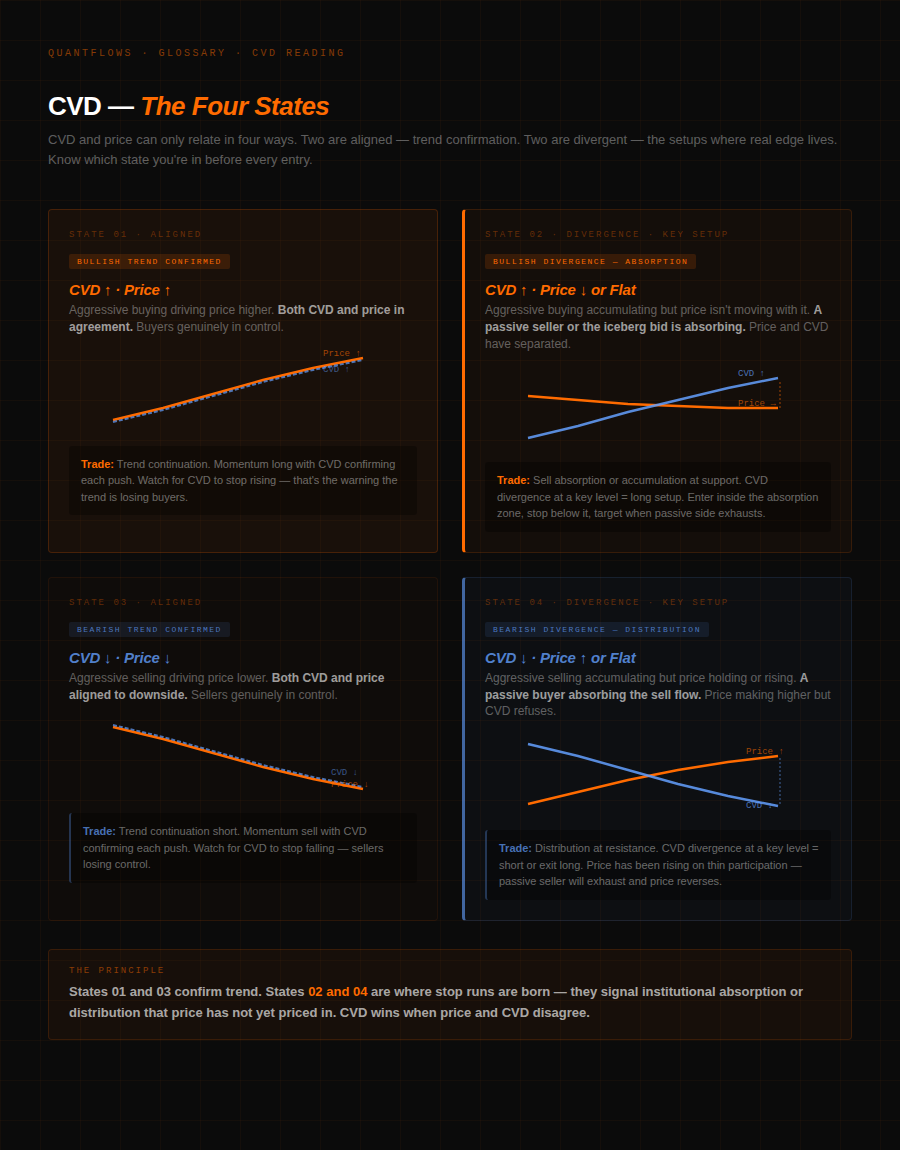
CVD (Cumulative Volume Delta) is the running net difference between aggressive buy volume and aggressive sell volume. As the QuantFlows CVD guide explains, CVD reveals whether bulls or bears are truly driving the market — not just which direction price moved, but whether real aggressive participation is behind it.
Four key readings:
- CVD rising, price rising — healthy uptrend. Buyers in control.
- CVD rising, price flat or falling — absorption. Aggressive buying exists but a passive seller absorbs it. Bullish lean when the passive side exhausts.
- CVD falling, price falling — healthy downtrend. Sellers in control.
- CVD falling, price rising or flat — distribution. Passive buyer holding the level. Bearish lean when exhausted.
The second and fourth readings are where stop runs are born.
What Is DOM — Depth of Market?
DOM (Depth of Market) is the live order book showing resting limit orders at each price level. As AlgoStorm's depth of market guide explains, DOM displays live resting limit orders showing intent to trade at each price — not executed trades, which is what footprint charts show. Key DOM behaviors: stacking (orders building = support forming), pulling (orders vanishing = fake liquidity), and absorption (reloading after each hit = institutional defense).
The DOM is a starting point, not a conclusion. Iceberg orders hide the majority of their size. Spoofed orders aren't real. Market makers reprice in milliseconds. Watch for replenishment patterns at key levels — a bid resetting to approximately the same size after each fill is an iceberg. A bid disappearing on approach is a spoof.
Ghost Wall / Phantom Liquidity
A ghost wall is a large DOM order that vanishes as price approaches — never executed. It creates false impressions of support or resistance. On the heatmap, it traces a diagonal streak that terminates before price contact — no CVD response, no Bubble Dots. An iceberg fills and replenishes with measurable CVD impact. For misread patterns, see the heatmap 101 guide.
What Is a Heatmap in Trading?
A heatmap plots order book depth over time as a two-dimensional color field — price on the Y-axis, time on the X-axis, color intensity representing resting limit order concentration. Bright orange bands are dense limit order zones. Dark areas are thin.
Three signals the heatmap makes visible: persistence (a level staying bright across many bars has structural size), drift (normal market maker quotes move diagonally — a fixed horizontal band is abnormal), and disappearance (a bright band going dark as price approaches is a ghost wall or pulled liquidity).
HVN and LVN — High and Low Volume Nodes
A High Volume Node (HVN) is a price level where significant historical volume traded — price slows and consolidates there on retests. A Low Volume Node (LVN) has almost no historical volume — price moves through fast with minimal friction. See the full framework in the DOM, footprint, volume profile guide.
What Is an Iceberg Order?
An iceberg order is a large limit order split into small visible tranches. The exchange shows 200 contracts while the total is 8,000. Each tranche fills and the next replenishes automatically. Detection: price-volume divergence, DOM resetting to same size after each fill, persistent fixed heatmap band. As the iceberg nears exhaustion, replenishment size shrinks — 200 → 180 → 140 → 90 → 40. Those shrinking resets are the exhaustion signal.
Liquidity Magnet and Liquidity Vacuum
A liquidity magnet is a price level with dense resting orders — stops, limit orders, or liquidation clusters — that price gravitates toward. Equal highs, round numbers, and prior session extremes are all magnets.
A liquidity vacuum is a price range with almost no resting orders where price moves fast. LVNs from volume profile are vacuum zones. Price entering a vacuum runs to the next magnet.
Point of Control (POC)
The Point of Control (POC) is the price level with the highest volume within a volume profile period — where the most contracts traded. Markets return to it after moving away. Yesterday's POC is frequently today's first significant test. Rising POC across sessions signals healthy trend acceptance. Flat POC against rising price signals structural divergence.
Spoofing
Spoofing is placing large visible orders with no intent to execute, then canceling them as price approaches. It's illegal in regulated markets and detectable on the heatmap through its disappearance signature — the order appears, influences surrounding behavior, then vanishes before execution. Same visual as a ghost wall.
How These Terms Form a System
Order flow terms aren't a vocabulary list — they're a chain. An iceberg creates absorption. Absorption shows up as CVD divergence. CVD divergence at a heatmap band with Bubble Dots firing is the entry. Stop below the HVN. Target at the LVN above — where price accelerates through the vacuum to the next POC. Every term in this glossary is a link in that chain.
Frequently Asked Questions
- What is order flow trading? Order flow trading is reading live buy and sell activity — aggressive market orders, resting limit orders, and their interaction — to understand who controls the market and at which specific price levels. As Metrotrade's order flow analysis guide notes, order flow tracks real-time buying and selling activity to reveal market intent beyond what price charts show alone.
- What is the difference between CVD and volume? Volume measures total contracts traded without regard to direction. CVD measures the net difference between aggressive buy and sell volume — it tells you which side is pressing and whether price is responding honestly to that pressure.
- What is the difference between a ghost wall and an iceberg order? A ghost wall is a fake order pulled before price arrives — no execution, no CVD response. An iceberg is real size split into visible tranches — it fills, replenishes, moves CVD, and leaves Bubble Market Dots. The DOM replenishment pattern separates them.
- What does a liquidity vacuum mean in trading? A liquidity vacuum is a price zone with almost no resting limit orders — typically a Low Volume Node. Price accelerates through it because there's no passive order flow to absorb directional momentum. It typically runs to the next liquidity magnet.
- What is a Bubble Market Dot in QuantFlows? A Bubble Market Dot fires when volume executing at a price level is anomalously large relative to the price movement it produces — the real-time fingerprint of institutional absorption. Multiple dots at the same level across retests confirm a structural defensive zone.
QuantFlows displays heatmap depth, CVD, and Bubble Market Dots across Binance, Bybit, OKX, and Hyperliquid in real time. Free during beta at quantflows.xyz.