The Problem With Every Standard Indicator
RSI tells you if something is overbought or oversold — based on past price. MACD measures momentum — based on past price. Moving averages smooth out trend direction — based on past price. Every classic indicator is a different way of reprocessing the same data: what price already did.
CVD is different. It measures what traders are actually doing right now — how aggressively buyers and sellers are hitting the market — and gives you a running score of who's winning.
What CVD Actually Measures
Every executed trade in the market falls into one of two categories:
Aggressive buy — a market order that hits the ask. A buyer who couldn't wait and paid whatever the seller was asking. This is demand coming to supply.
Aggressive sell — a market order that hits the bid. A seller who couldn't wait and accepted whatever the buyer was offering. This is supply coming to demand.
CVD takes every trade, classifies it as one or the other, calculates the difference (buy volume minus sell volume) for each period, and adds it to a running total. The result is a line that shows the cumulative net balance between buying and selling aggression over time.
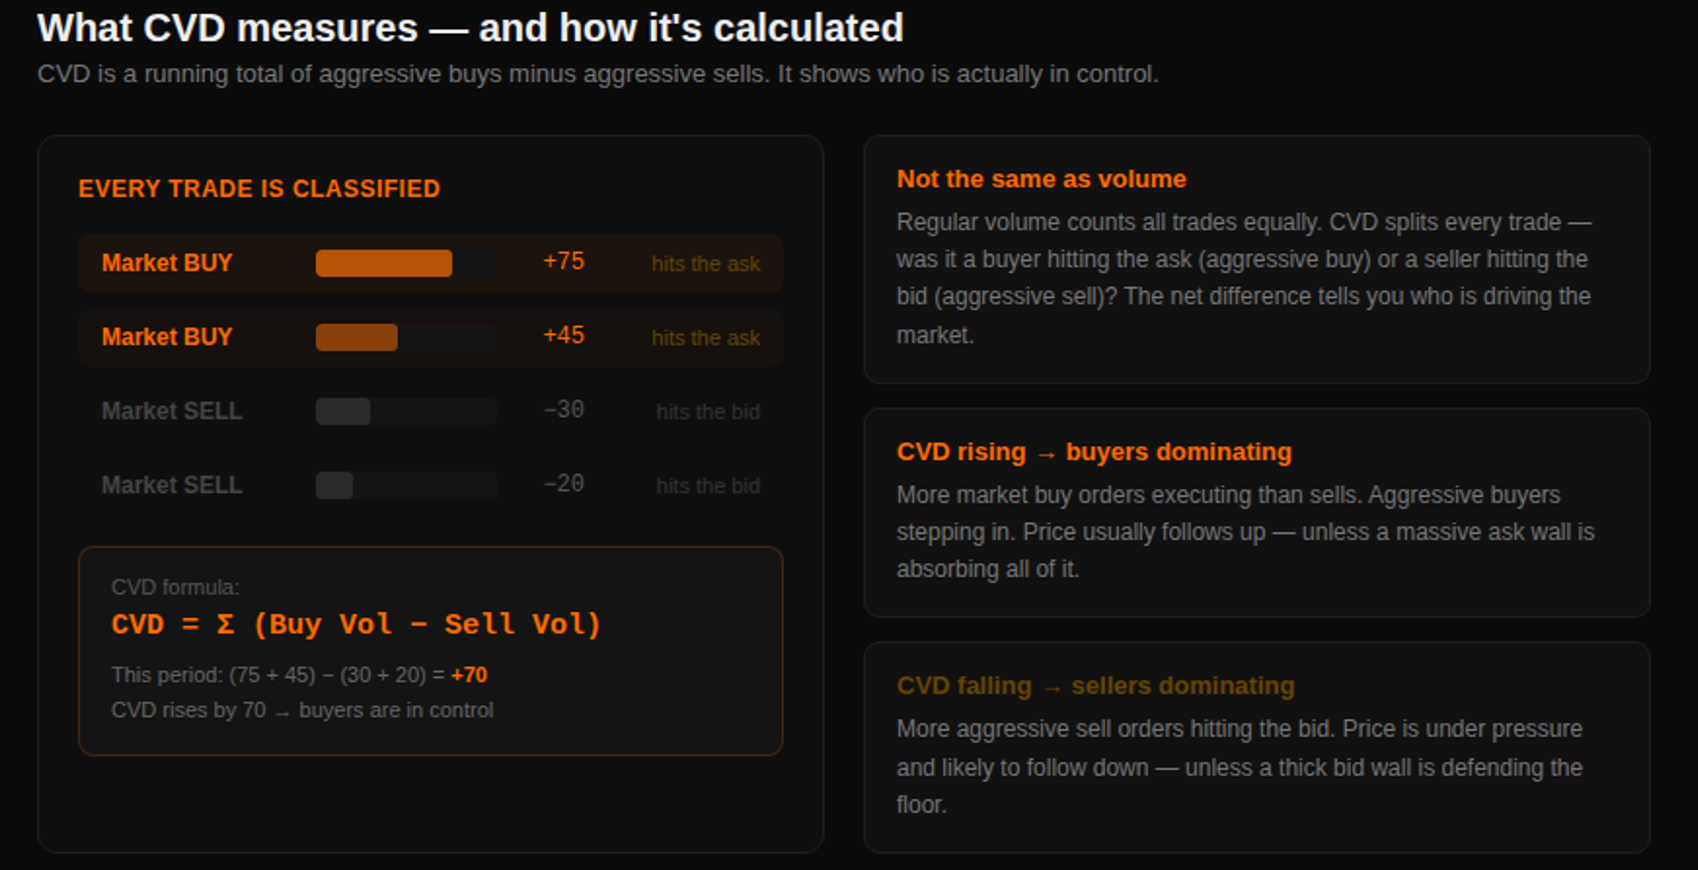
The formula: CVD = Σ (Aggressive Buy Volume − Aggressive Sell Volume)
CVD rising means more aggressive buying than selling. Buyers are taking liquidity, stepping up to the ask, demanding to be filled. CVD falling means the opposite — sellers are dominant, hitting bids, forcing their way in.
This is fundamentally different from regular volume, which just counts all trades equally. CVD tells you the direction of the aggression. And in markets, the aggressor moves price.
Reading the CVD Line
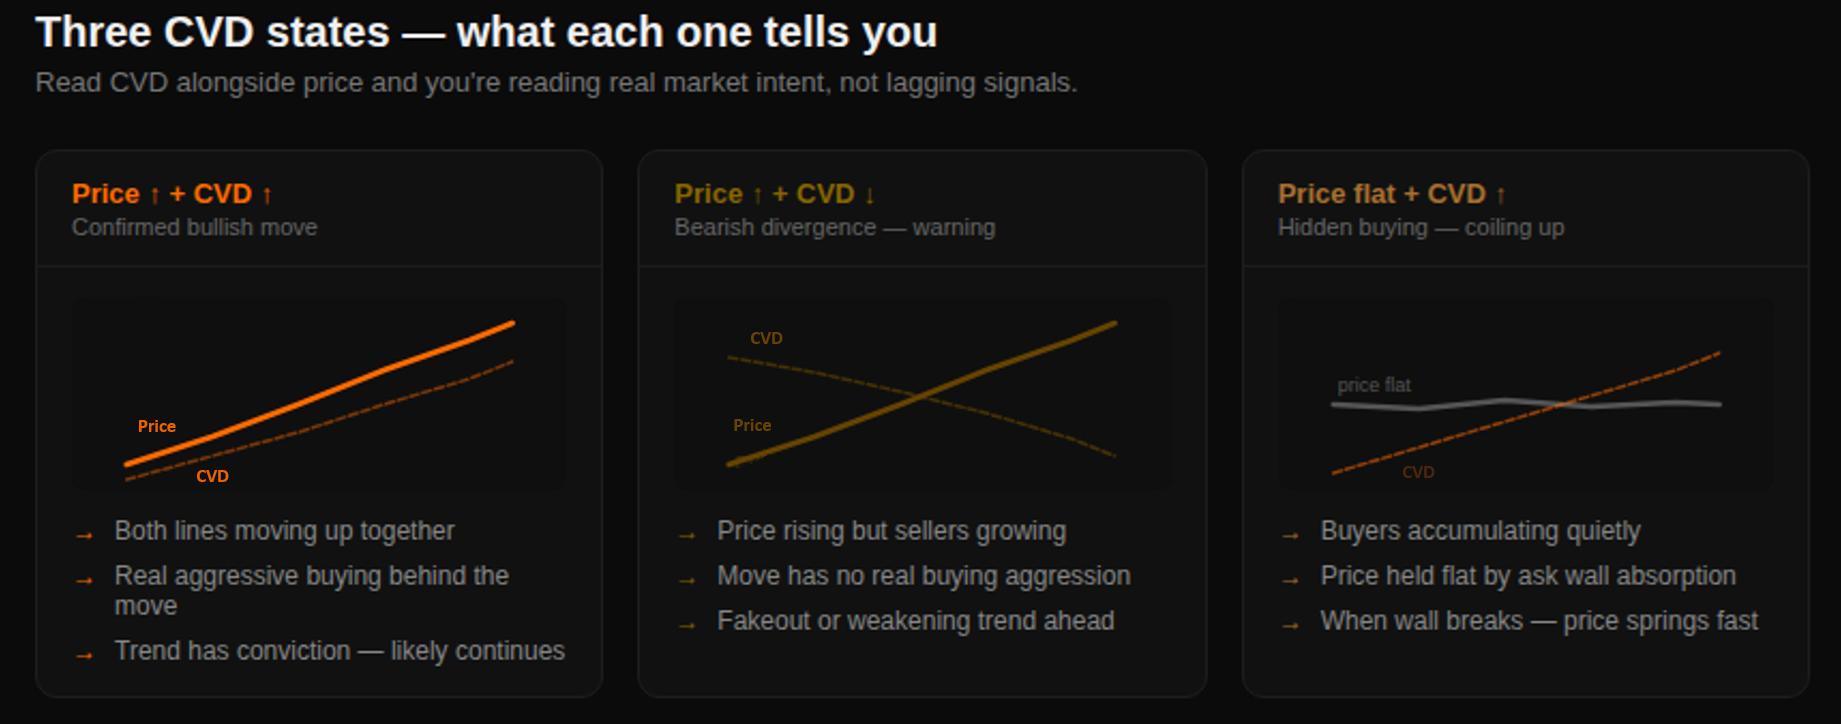
Price up + CVD up = confirmed move. Both lines rising together means real aggressive buying is behind the price increase. Volume and intent are aligned. This is the cleanest bullish signal — the move has actual fuel behind it and is more likely to continue.
Price up + CVD down = bearish divergence. Price is rising but the CVD is falling — meaning sellers are actually growing more aggressive while price pushes up. This is the market showing its hand early. The price move has no real buying pressure behind it. Buyers are exhausted. A reversal or sharp pullback is being set up.
Price flat + CVD rising = hidden accumulation. Price isn't moving — maybe a thick ask wall is holding it back — but CVD is climbing steadily. Buyers are quietly accumulating, absorbing the sell side without moving price yet. When the wall eventually breaks or gets pulled, price can spring fast because the buying pressure has been building up behind it the whole time.
CVD Divergence: The Signal Worth Waiting For
The most powerful CVD setup is divergence — when price and CVD are moving in opposite directions at the same time.
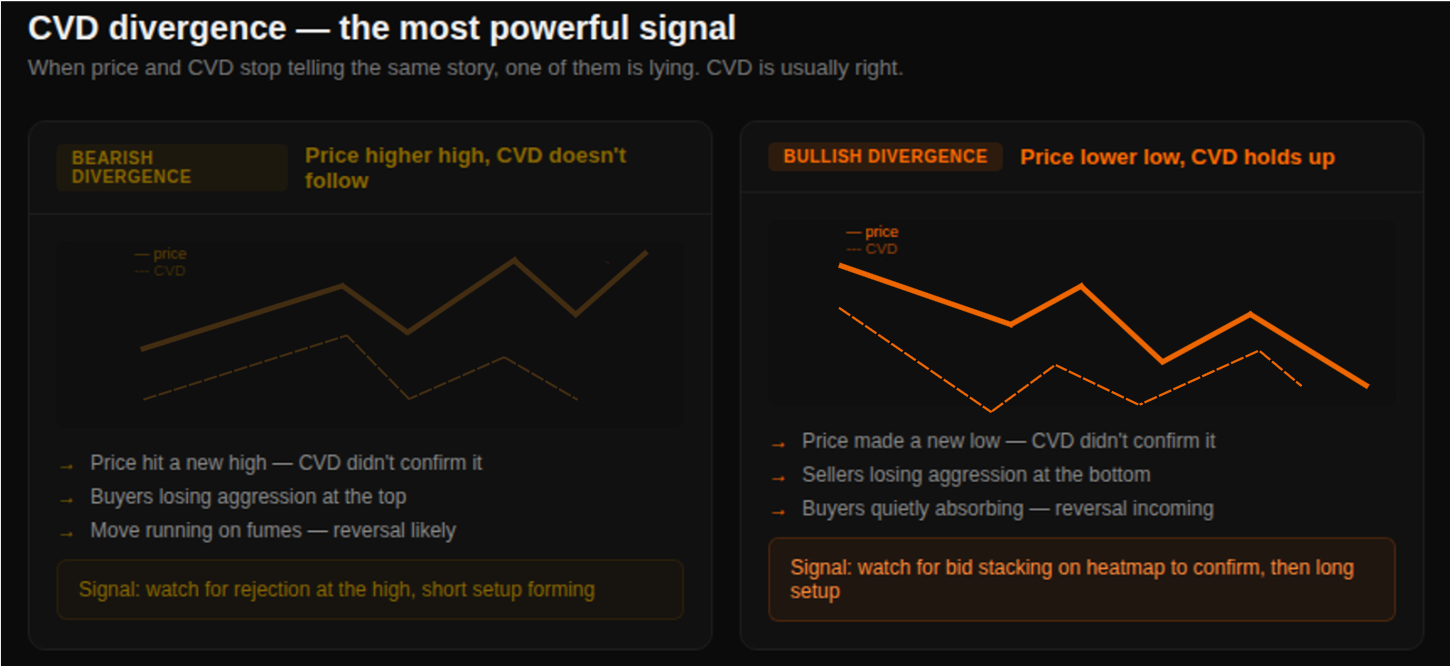
Bearish divergence: price makes a higher high but CVD makes a lower high or starts falling. Price went up, but the buying aggression that should have driven it there isn't showing up in the data. Whoever pushed price to that new high didn't have real order flow behind them. This is buyer exhaustion at a high. It often precedes a reversal — especially when combined with a visible ask wall on the heatmap at that level.
Bullish divergence: price makes a lower low but CVD makes a higher low or stabilizes. Price dropped, but sellers aren't actually getting more aggressive — CVD is holding up. The sell side is running out of steam at the bottom. Buyers are quietly absorbing the pressure. This often precedes a reversal to the upside — especially when a thick bid wall is visible on the heatmap below price.
One important note on using divergence: it's a warning, not an entry signal on its own. Divergence at a random price level in the middle of a range doesn't mean much. Divergence at a meaningful level — a visible liquidity wall, a prior high or low, a VWAP extreme — carries far more weight. The confluence of CVD divergence plus a real order book context is what makes it actionable.
CVD Doesn't Predict Price. It Reads Intent.
There's an important distinction here. CVD doesn't tell you where price is going. It tells you whether the current move has real conviction behind it or is running on fumes.
A rising price with rising CVD could still reverse if it hits a massive wall. A price with bearish CVD divergence could still keep climbing if that wall gets pulled and no sellers step in. The market is never certain.
What CVD does is shift the question from "where will price go?" to "is the current move backed by real aggression, or is it hollow?" That's a better question because it has a real-time answer visible in the data.
When price rises with CVD confirmation, you have evidence of genuine buyer participation. When price rises while CVD falls, you have evidence that the surface move and the underlying order flow are telling two different stories. One of them is likely to correct.
How QuantFlows Shows CVD
In QuantFlows, CVD is displayed as part of the Order Flow layer alongside the live heatmap. You can watch CVD tick in real time as trades execute — seeing whether the aggression at any given moment is buying-dominated or selling-dominated — while simultaneously watching where liquidity is stacked on the heatmap.
When a price level is being approached and you can see CVD building in one direction while the book shows a wall on the other side, you can read in real time whether the move has the force to break through or will likely stall and reverse.
This is what institutional-grade order flow analysis actually looks like in practice. Not a single magic indicator — but reading multiple data streams simultaneously and letting them confirm or contradict each other.
QuantFlows shows CVD live alongside the heatmap across Binance, Bybit, OKX, and Hyperliquid.