Key Takeaways
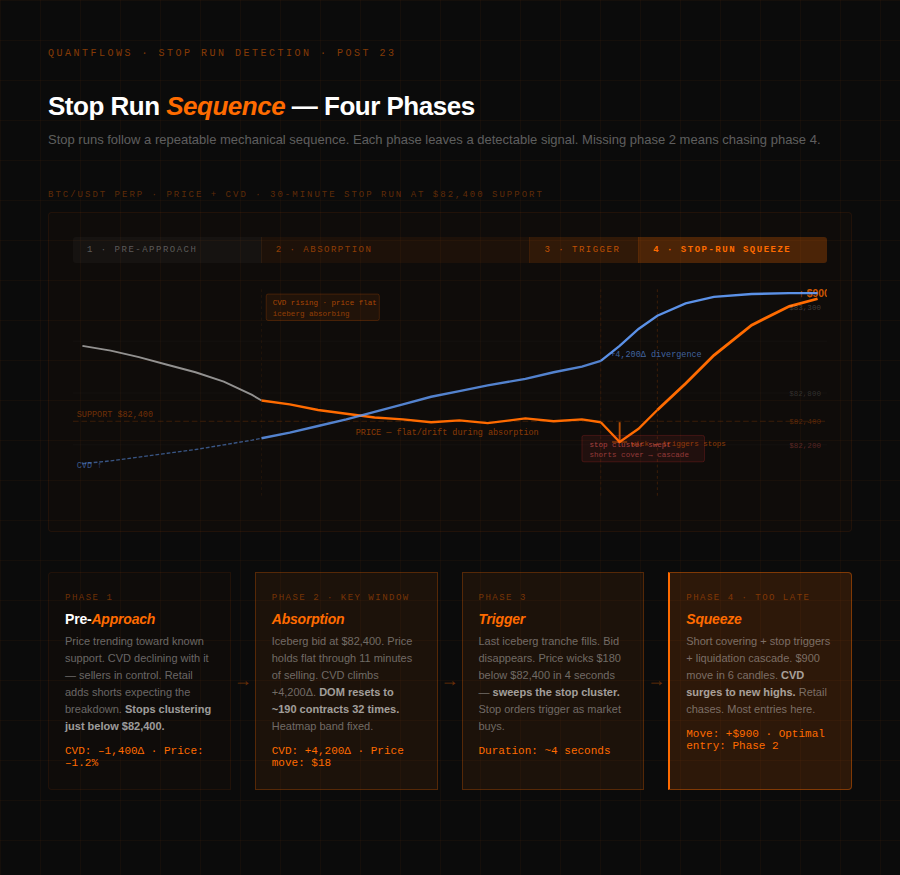
- A stop run is a four-phase mechanical sequence — accumulation, absorption, trigger, squeeze — and each phase has a detectable signal before the spike fires.
- CVD (Cumulative Volume Delta) rising while price falls is the pre-run signal. A passive bid is absorbing aggressive selling before the trigger fires.
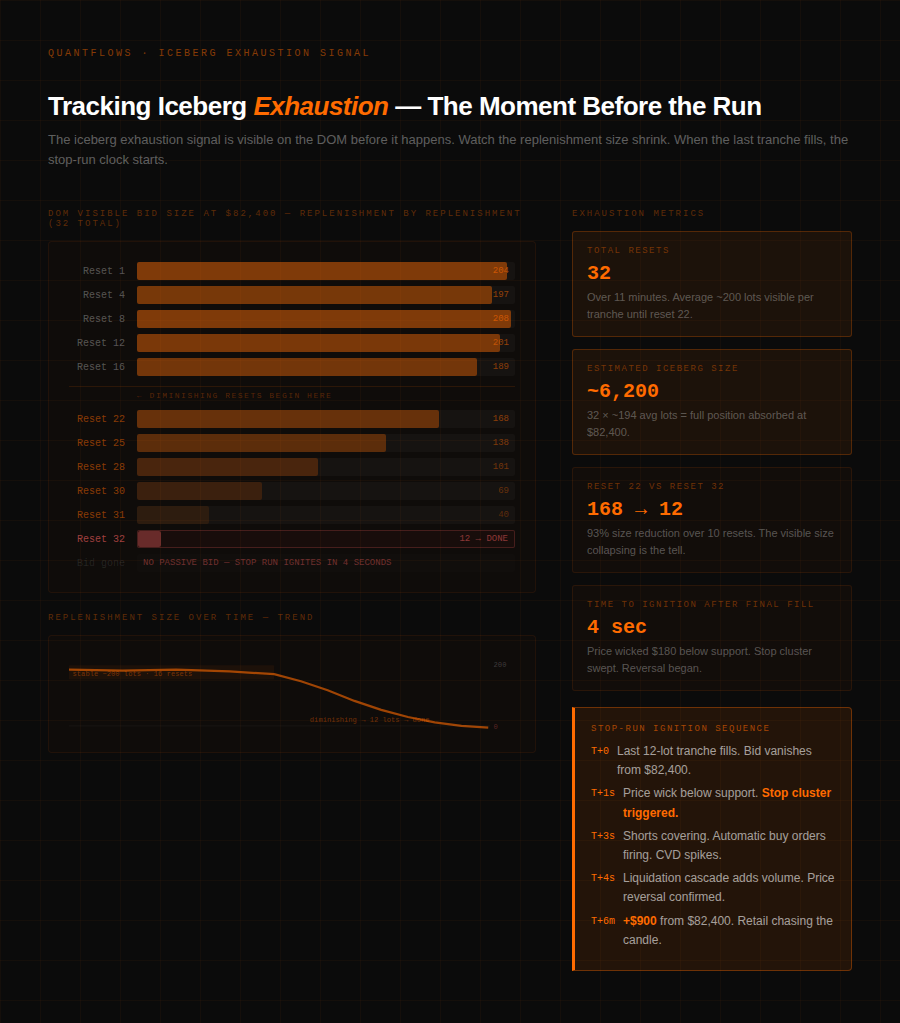
- Diminishing DOM replenishment (200 → 140 → 90 lots) signals iceberg exhaustion — the stop run ignites within seconds of the last tranche filling.
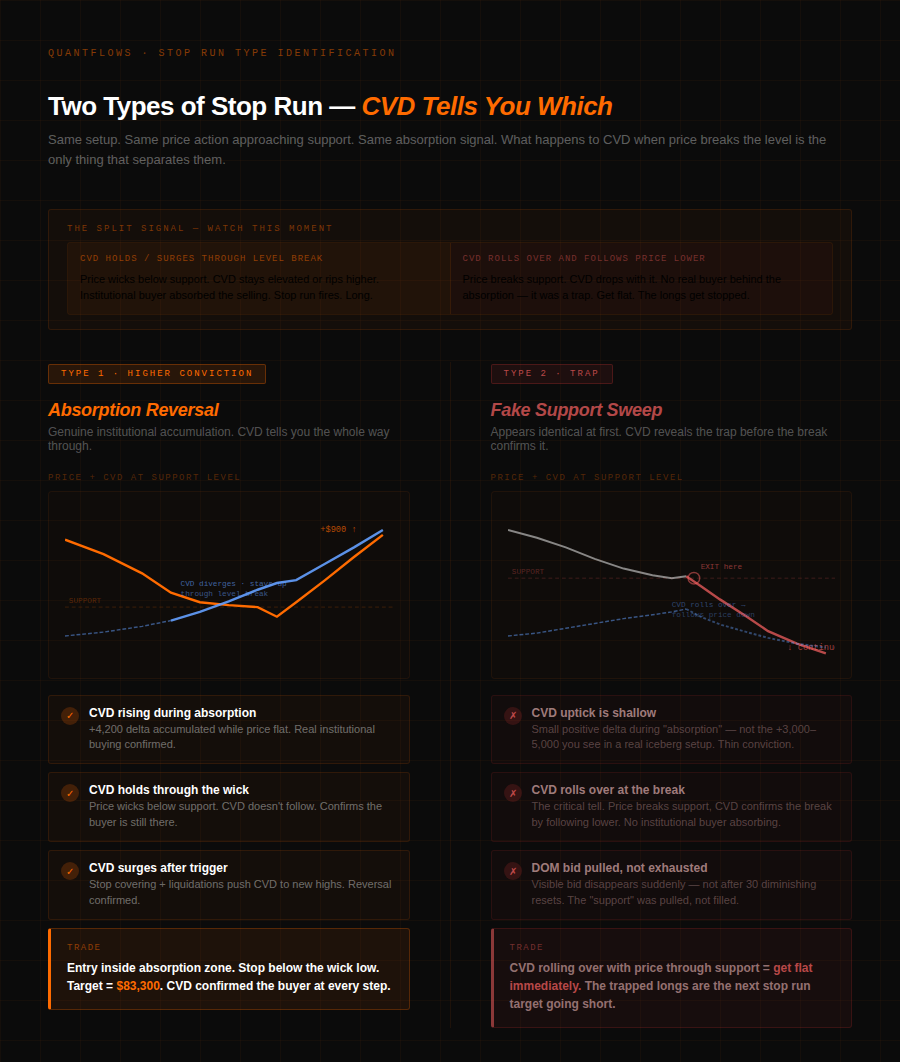
- Two stop run types: absorption reversal (CVD holds through the break = long) and fake support sweep (CVD rolls over = exit immediately).
- QuantFlows is a real-time order flow analytics platform that aggregates heatmap, CVD, and liquidation data across Binance, Bybit, OKX, and Hyperliquid simultaneously.
Eleven minutes before BTC ripped $900 off support, CVD was rising. Price held $82,400 flat through six red candles. Aggressive selling printed 4,200 delta of net pressure — and moved the market exactly $18. The stop run fired the moment the iceberg exhausted. Most traders chased the candle. The correct entry was eleven minutes earlier.
A stop run is not random volatility — it's a mechanical sequence with readable preconditions. QuantFlows is a real-time order flow analytics platform that aggregates heatmap, CVD, and liquidation data across Binance, Bybit, OKX, and Hyperliquid simultaneously. Detecting stop runs is one of the highest-value applications of that data.
What Is a Stop Run in Crypto Futures?
A stop run is a price move engineered specifically to trigger stop-loss orders clustered at a predictable level. Those stops convert into market orders when hit. Those market orders add fuel to the move. The cascade runs until the stop cluster is exhausted.
As ACY's stop hunting education guide explains, stop hunts happen at the most obvious technical levels — prior day highs and lows, session extremes, and round numbers — because that's exactly where retail stop-loss orders concentrate. Price sweeps those levels, triggers the stops, then reverses sharply.
In crypto futures, the mechanics are amplified. Leverage concentrates stop placement — traders running 5x–20x put stops at the same obvious levels. Liquidation engines on Binance, Bybit, OKX, and Hyperliquid add another layer: liquidation prices cluster at similar levels as manual stops. When price sweeps that zone, it's not just stops triggering — it's liquidations cascading, funding flipping, and short-covering all hitting simultaneously.
How CVD Reveals the Stop Run Before the Trigger
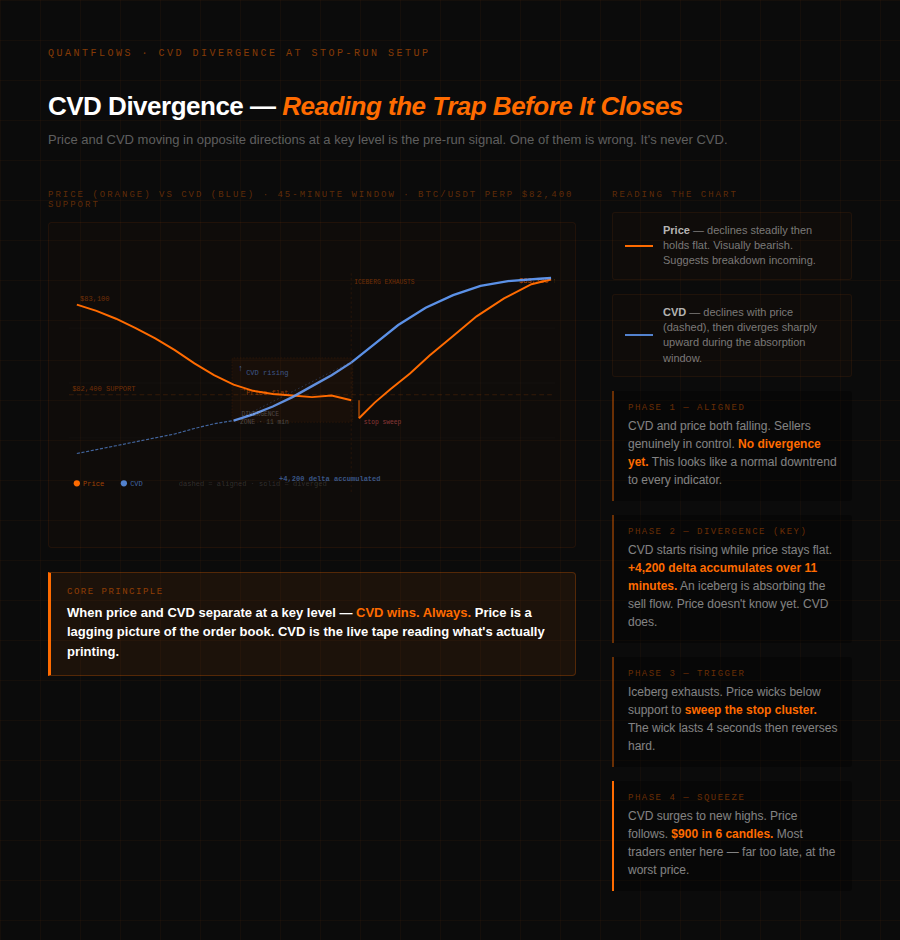
CVD (Cumulative Volume Delta) rising while price falls at a support level is the primary pre-run signal. As Phemex's CVD trading guide explains, CVD maintains a running total of the net difference between trades executed at the ask and trades at the bid — when CVD rises while price is falling or flat, buyers are consistently stronger than the price action suggests.
The textbook setup: price approaches well-known support with CVD declining — sellers in control, the technical picture looks bearish, stops below the level are obvious. Retail shorts add, expecting breakdown. Then price nips $80–200 below the support, triggering the stop cluster, CVD spikes hard on the short-covering and liquidation buying — and price reverses sharply.
The pre-run CVD signal is the other side of this. Before the trigger, an institutional buyer accumulates at or near the support using an iceberg order. CVD starts rising while price is flat or drifting lower. The delta is positive — more aggressive buying than selling — but price isn't moving because the iceberg bid absorbs the sell flow below. As QuantFlows details in the CVD guide, this divergence between CVD and price is one of the clearest reads of hidden institutional positioning available to a retail trader.
When CVD diverges from price at a key level, one of them is wrong. Price is a lagging representation of the order book. CVD is the live tape. CVD wins.
Reading Iceberg Exhaustion Before the Run Fires
The iceberg is what makes CVD divergence possible. Without a large hidden passive bid absorbing the aggressive selling, CVD couldn't rise while price fell.
Three observations confirm an active iceberg at support: price holding flat despite heavy volume, the DOM resetting to the same visible size after each fill, and a persistent bright heatmap band that doesn't drift. For the full detection framework, see the iceberg orders and hidden liquidity guide.
The exhaustion signal specific to stop runs: visible DOM replenishment size shrinks progressively. A bid resetting consistently at ~200 lots begins resetting at 180, then 140, then 90, then 40. When the last tranche fills — visible as the bid dropping to under 30 lots before disappearing entirely — two things happen simultaneously: the passive buy pressure vanishes, and every short holding through the absorption is immediately wrong. Their stops — sitting just below the support — are clustered and reachable. That's when CVD surges — not from new buyers, but from shorts covering and stop-loss orders triggering en masse.
Two Types of Stop Run — CVD Tells You Which
Not every stop run leads to a sustained reversal. The distinguishing tell is what CVD does when price breaks the level.
The absorption reversal is the higher-conviction setup. A genuine institutional buyer accumulates at a structural level, fully absorbs the available sell pressure, and lets price run as the stop cluster triggers. CVD rises through the absorption phase and stays elevated or surges when price briefly breaks — it never confirms the breakdown.
The fake support sweep looks identical until the break. Price approaches a level, smaller absorption appears to trap shorts into believing support holds — then the iceberg is pulled, the level breaks, trapped longs get stopped, and the move accelerates lower. CVD rises initially during the faux absorption, then cracks and follows price through the level.
Same price action. Opposite trades. CVD is the only thing that separates them in real time. For how this dynamic maps to market structure, see the QuantFlows order flow analysis guide.
How QuantFlows Surfaces the Pre-Run Signal
Reading CVD divergence, tracking iceberg replenishment counts, and monitoring heatmap band persistence across four exchanges in a live market is not a manual process. The window between iceberg exhaustion and stop-run ignition is measured in seconds, not minutes.
QuantFlows aggregates order flow across Binance, Bybit, OKX, and Hyperliquid in a single view. The heatmap surfaces persistent bid walls as fixed bright bands — the iceberg's footprint. CVD shows the divergence building in real time. Bubble Market Dots flag the anomalous volume-to-price relationship during absorption: high volume, minimal price movement — the mechanical signature of an iceberg eating the selling pressure.
When persistent heatmap band, rising CVD against falling price, and Bubble Dots firing all align at a known structural level — the pre-conditions for a stop run are present. The entry is before the trigger. Not after the $900 spike.
Frequently Asked Questions
What is a stop run in crypto futures trading? A stop run is a deliberate price move designed to trigger stop-loss orders clustered at a predictable level — typically just below support or above resistance. In crypto futures, liquidation cascades from leverage amplify the effect, creating fast one-sided moves that follow a readable four-phase pattern.
How does CVD detect a stop run before it happens? CVD (Cumulative Volume Delta) rising while price falls at a support level means a large passive bid is absorbing aggressive selling. This divergence — positive delta accumulating without price movement — is the pre-run absorption signal. When CVD rises for 6–8 bars while price holds flat with DOM replenishment patterns, the stop run setup is forming.
What is the difference between an absorption reversal and a fake support sweep? In an absorption reversal, CVD rises through the absorption phase and holds or surges when price briefly breaks the level — confirming a real institutional buyer. In a fake support sweep, CVD initially rises but then rolls over and follows price lower through the break. Same price action, opposite trades.
How do you know when the iceberg is about to exhaust? Watch DOM replenishment size. A bid resetting at approximately 200 contracts that starts resetting at 180, 140, 90, and finally under 40 lots is signaling exhaustion. The stop run typically fires within seconds of the final tranche filling.
Why does price move sharply after a stop run triggers? When the final iceberg tranche fills, the passive bid disappears. Aggressive buying that was being absorbed now has no resistance. Simultaneously, shorts who held through absorption are instantly wrong — their stop-losses trigger as market orders, adding fuel. This combination produces the fast, sharp post-exhaustion move.
QuantFlows shows CVD divergence, heatmap absorption clusters, and Bubble Market Dots across four exchanges simultaneously. Free during beta at quantflows.xyz.