Key Takeaways
- Volume profile plots total traded volume horizontally by price level — revealing where real participation happened, not just where price went.
- The Point of Control (POC) is the highest-volume price level — it acts as a market magnet, with price frequently returning to retest it the following session.
- High Volume Nodes (HVNs) slow price down. Low Volume Nodes (LVNs) accelerate it. Knowing which one is ahead changes your target and stop placement entirely.
- A volume profile level without live order flow confirmation is a hypothesis. CVD, heatmap, and Bubble Dots confirming it turn it into a trade.
- POC migration across sessions is a trend health signal — rising POC with rising price means real acceptance. Flat POC against new highs is a structural warning.
Price didn't stall at $83,400 because of a trendline. It stalled because 18% of the prior session's total volume printed there — a dense concentration of agreed-upon value sitting in the market's memory. Volume profile found it. A candlestick chart didn't.
Volume profile answers one question: where did real participation happen? QuantFlows is a real-time order flow analytics platform that aggregates heatmap, CVD, and liquidation data across Binance, Bybit, OKX, and Hyperliquid simultaneously — and volume profile is the historical structural layer it works alongside to confirm live trades.
What Is Volume Profile in Trading?
Volume profile is a charting tool that plots total traded volume horizontally at each price level, not vertically in time bars. The result is a distribution histogram showing exactly where market participants transacted. A wide bar means heavy activity. A thin bar means almost nothing happened there.
As Optimus Futures explains in their volume profile trading guide, volume profiles tell traders which prices saw the most and least volume — identifying a value range as well as a Point of Control where the highest volume occurs, unlike market profile which measures time spent at each price.
Three components matter for crypto futures traders.
The Point of Control (POC) is the single price level with the highest traded volume across the session or lookback window — the price where buyers and sellers reached the most agreement. According to OrderFlow Labs' volume profile guide for futures traders, the POC represents the market's fairest price and acts as a magnet — price is drawn back to it repeatedly after moving away. Yesterday's POC frequently becomes today's first significant test level.
The Value Area contains 70% of the session's total volume, centered around the POC. Its upper boundary is the Value Area High (VAH) and its lower is the Value Area Low (VAL). Price inside the value area means the market is in balance. Price outside signals either a fade back into range or a genuine breakout — and as QuantFlows covers in the how price actually moves guide, the order book behavior at that boundary separates real breakouts from fakeouts.
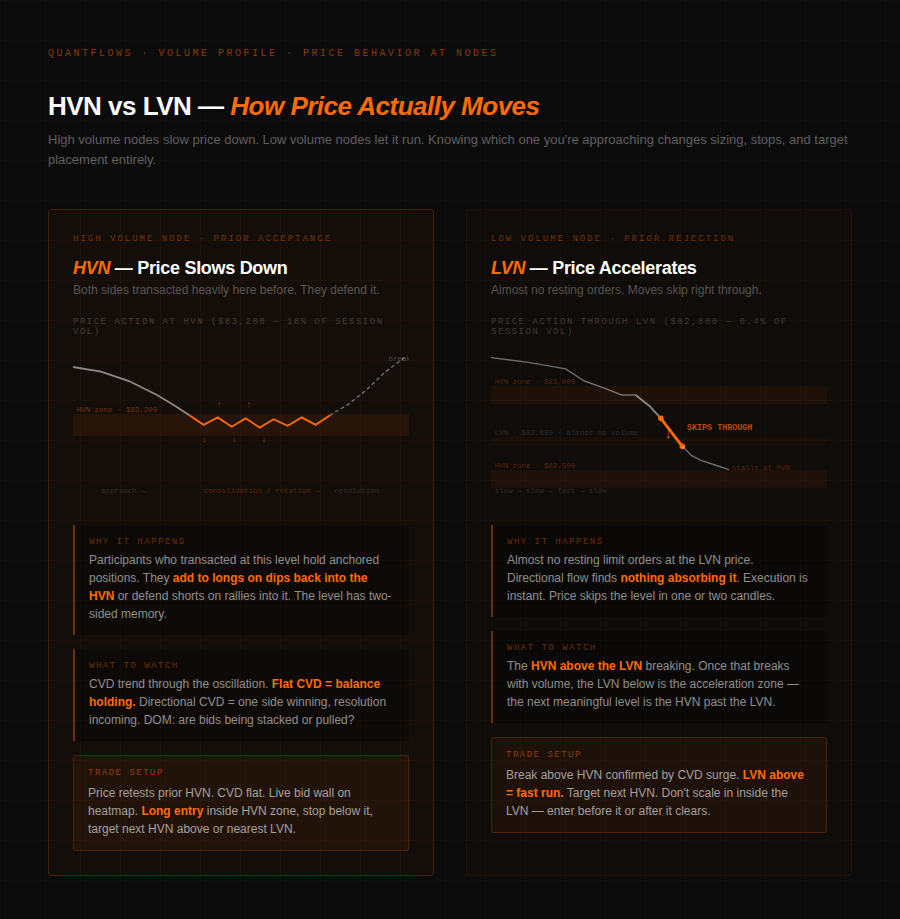
High Volume Nodes (HVNs) and Low Volume Nodes (LVNs) are the distribution's peaks and troughs. HVNs are areas of prior acceptance — price slows and consolidates there on retests. LVNs are thin zones where price moved fast before and will again — almost no resting orders create friction.
![Volume profile anatomy showing POC, Value Area High and Low, HVN and LVN labels on a BTC/USDT session profile]](https://cdn.sanity.io/images/6jgu85ip/production/76bda0674a52593cdd8eecb7c2e3562fadcceaf0-900x909.png)
How Price Behaves Differently at HVNs vs LVNs
At High Volume Nodes, price slows down. Participants who transacted heavily at that level hold positions anchored to that price and defend it on retests. Both sides previously transacted there — both sides remember it.
At Low Volume Nodes, price accelerates. When a level printed little volume historically, almost no resting limit orders exist to create friction. A breakout through a thin LVN moves fast because there's nothing absorbing the directional flow. As QuantFlows details in the DOM, Footprint, Volume Profile guide, volume profile shows where volume was historically concentrated but provides no explanation of whether that concentration will repeat — which is exactly why order flow confirmation is required.
The practical setup: price breaks above a prior HVN and pulls back to retest it. If CVD (Cumulative Volume Delta) stays flat or rises through the test, that's a legitimate long entry with clear invalidation below the HVN range. If CVD drops sharply on the retest, the breakdown targets the next HVN lower. The HVN identifies the level. CVD tells you what's happening at it in real time.
Why Volume Profile Cannot Work Without Order Flow
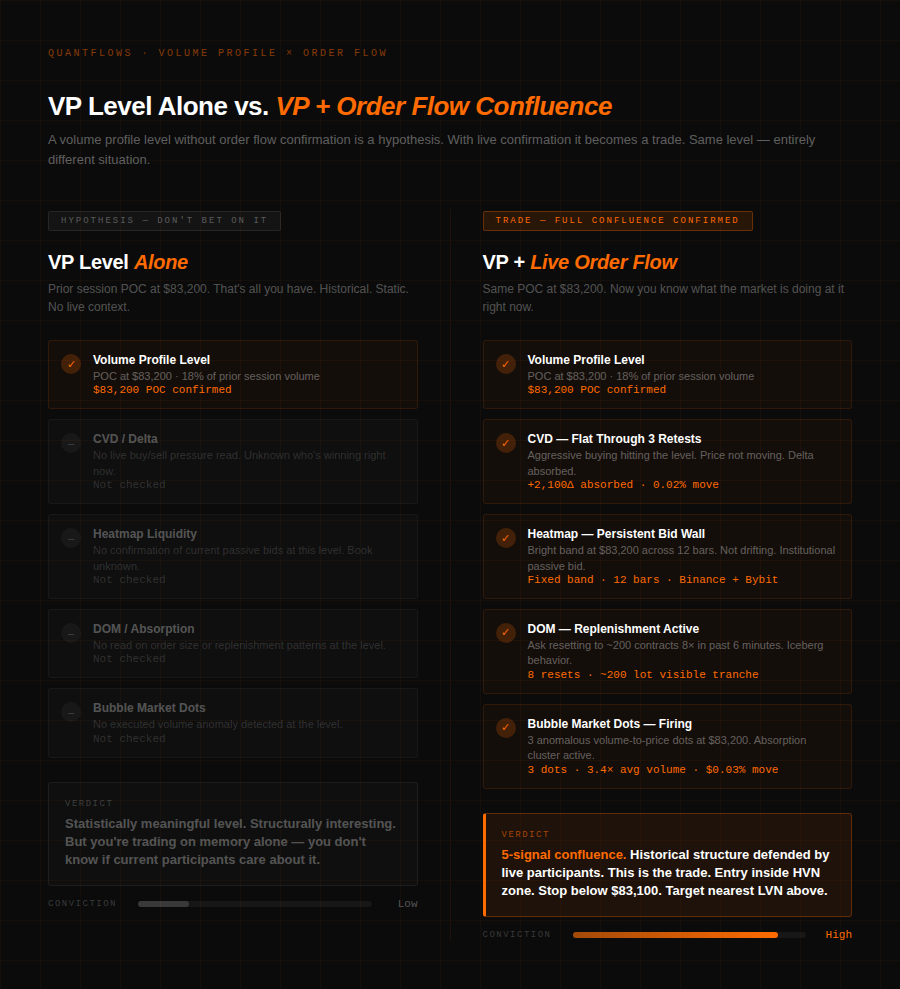
Volume profile is historical. It shows where trading happened — not where it's happening now. The POC from yesterday is relevant until today's participants decide that price is no longer fair at that level.
When price approaches a POC or VAL with CVD trending in the direction of the test and the DOM showing aggressive orders stacking at that level in real time, the historical structure is being confirmed by current participants. That's confluence — not guessing at a line. The opposite is equally important: price approaching an HVN with CVD diverging and limit orders being pulled means current intent is overriding the histogram.
A volume profile level with no order flow context is a hypothesis. Confirmed by live CVD, DOM, and heatmap data, it's a trade.
How to Read POC Migration for Trend Health
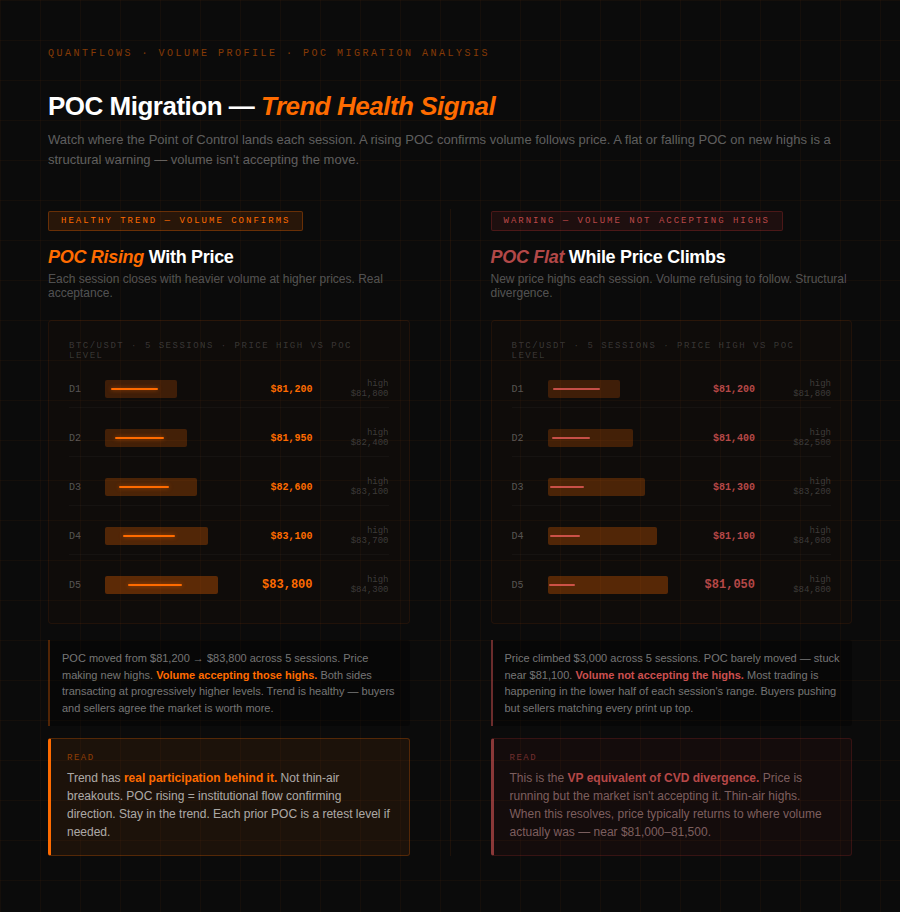
When the daily POC moves higher across multiple sessions, price is finding acceptance at progressively higher levels — real two-sided participation, not thin-air breakouts. As QuantFlows' CVD guide explains, a rising price with rising CVD represents the cleanest bullish signal when volume, intent, and structural acceptance are all aligned.
When price makes new highs but the POC stays flat or drifts lower, volume isn't following price. That divergence is the volume profile equivalent of CVD divergence — a structural warning that the trend lacks acceptance and is vulnerable to a sharp correction back toward the volume-accepted range.
POC migration costs nothing to track. Mark yesterday's POC before the session opens. Watch whether today's early order flow respects or ignores it.
How QuantFlows Combines Volume Structure and Live Order Flow
Volume profile tells you where the market has been. Order flow tells you what participants are doing right now. QuantFlows puts both in the same view across Binance, Bybit, OKX, and Hyperliquid simultaneously.
When a prior POC coincides with a persistent bright heatmap band — concentrated resting liquidity at that price in the live book — historical volume acceptance and current passive liquidity are aligned. Bubble Market Dots at the same level confirm that executed volume is anomalously large relative to price movement — the live absorption signature at a structurally significant zone.
A high-volume node retest with an active limit order wall in the heatmap and CVD staying flat through three retests: entry inside the HVN zone. Stop below the HVN. Target is the nearest LVN above where price will accelerate once friction disappears. That's the full stack: historical structure, live liquidity, and execution signal in one read.
Frequently Asked Questions
What is volume profile in crypto futures trading? Volume profile plots total traded volume at each price level — not over time — revealing the POC, High Volume Nodes where price slows, and Low Volume Nodes where price accelerates.
- What is the Point of Control (POC)? The POC is the price level with the highest traded volume in the selected period. It acts as a market magnet — price returns to it after moving away. Yesterday's POC is frequently today's first major test level.
- What is the difference between HVN and LVN? A High Volume Node has significant historical volume — price slows and consolidates there on retests. A Low Volume Node has almost no historical volume — price accelerates through it with minimal friction.
- How do you combine volume profile with order flow? Volume profile identifies where to look. Live CVD, heatmap band presence, and Bubble Market Dots confirm whether current participants are defending or abandoning that level. Without order flow, any VP level is only a hypothesis.
- What does POC migration tell you about trend health? A rising POC alongside rising price confirms real volume acceptance. A flat or falling POC against rising price is a structural warning — volume is not accepting the new highs, similar to CVD divergence.
QuantFlows brings together volume structure, real-time heatmap depth, and CVD across four exchanges in a single view. Free during beta at quantflows.xyz.