BTC spent four days grinding sideways between $92,800 and $93,400. Volume was below average. CVD barely moved. Nothing on the chart gave a directional read. Then price broke out 6% in 14 hours and didn't look back. Retail called it a surprise move. The accumulation phase had been running in plain sight for 96 hours — just not in any candle.
Institutional traders don't telegraph entries. They can't. A fund moving $200 million into BTC perps across Binance, Bybit, OKX, and Hyperliquid can't do it in one order without destroying its own fill price. The order has to be sliced, distributed, and executed in ways that minimize market impact. That execution leaves specific patterns in order flow data that candles never capture — but QuantFlows does.
Why Institutions Can't Just Buy
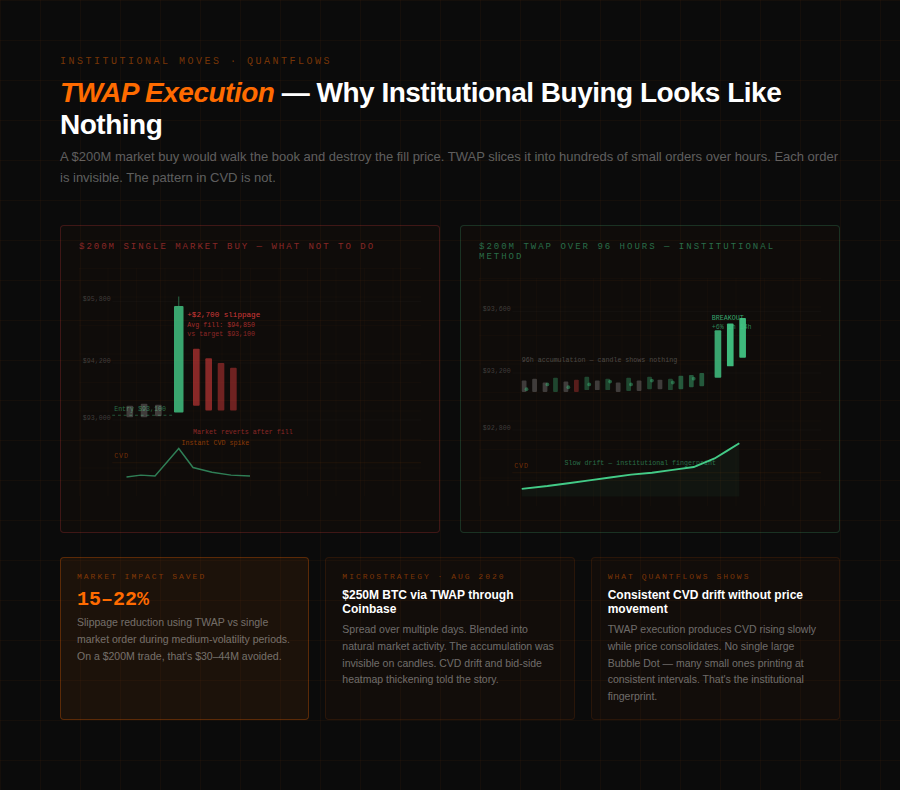
The math of institutional size makes discretion non-negotiable. When MicroStrategy made its $250 million BTC purchase in August 2020, executing it as a single market order would have walked the book so severely that the average fill would have been materially worse than the starting price. Instead, they partnered with Coinbase and used a TWAP — Time-Weighted Average Price — algorithm, spreading the purchase across several days at consistent intervals to blend into natural market activity and minimize footprint.
That approach is standard. TWAP execution distributes orders evenly over a time window, making each individual order small enough to avoid meaningful market impact. VWAP execution — Volume-Weighted Average Price — goes further, concentrating orders during high-volume periods when the book is deep enough to absorb them without slippage.
Using TWAP on major platforms reduces price slippage by approximately 15–22% compared to standard market orders during medium-volatility periods. For a $200M position, that difference is $30–44 million in avoided slippage.
The consequence for other traders is that institutional accumulation looks like noise on a candle chart. A consistent stream of small market buys hitting the ask every few minutes doesn't produce a single large green candle — it produces a flat, low-volatility grind. CVD rises slowly. The heatmap bid stack thickens marginally. Nothing screams "someone large is buying." That's the point.
The Four Footprints Institutions Leave
Institutional execution is designed to hide from simple observation. It's not designed to be invisible to order flow data. Four specific patterns consistently appear in QuantFlows when large players are active.
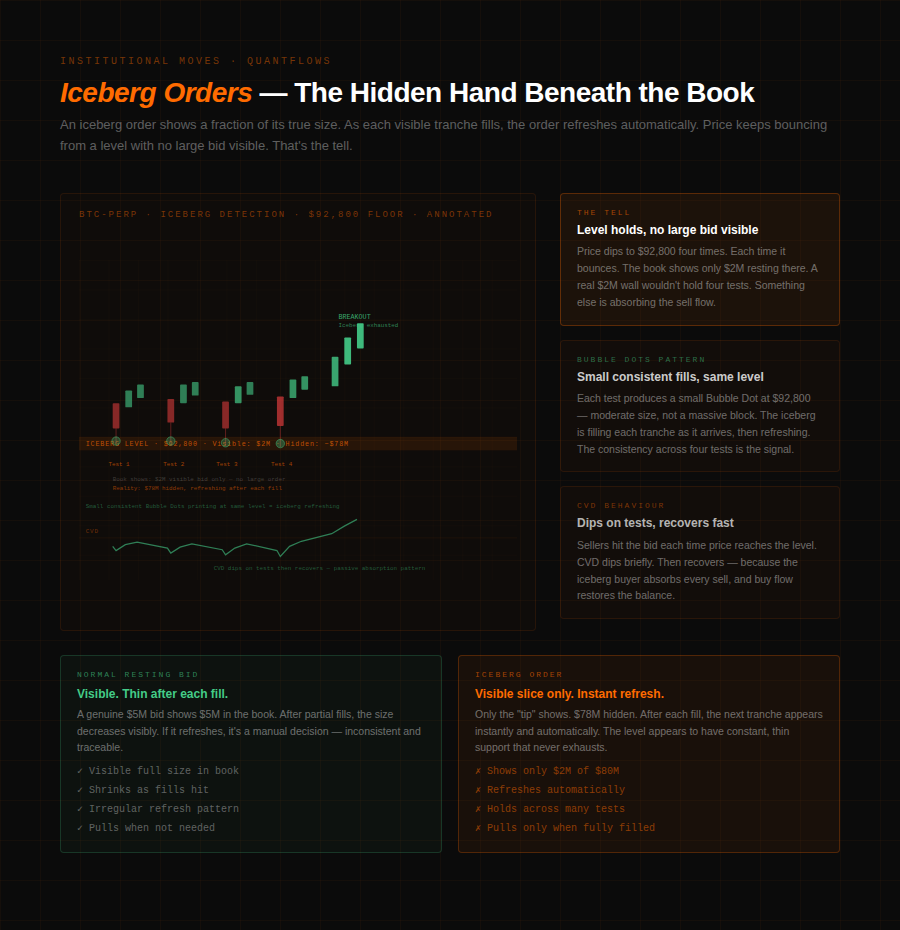
- Iceberg orders. An iceberg is a large limit order where only a fraction of the total size is visible in the book at any moment. A fund buying $80M of BTC might show only $2M in the visible bid — the remaining $78M replenishes automatically as each visible tranche fills. The tells are specific: price repeatedly tests a level and bounces, yet no large bid is visible in the book.
Small fills print consistently at the same price. The level holds across multiple tests. In QuantFlows, the heatmap shows a level that persistently holds even as Bubble Market Dots register moderate-sized fills printing there repeatedly — an iceberg refreshing behind the visible book. - Passive absorption. Institutions building large positions often use the opposite approach from aggressive market buying. Instead of lifting the ask, they place large resting bids and wait for sellers to come to them. This produces a specific pattern: price dips into the level, moderate sell flow prints, and price bounces — but CVD doesn't confirm aggressive buying.
The bounce wasn't driven by market buys lifting the ask. It was driven by a passive institution absorbing every sell that arrived. Bubble Market Dots in QuantFlows show moderate buy prints at the bounce point without the corresponding CVD spike that aggressive buying would produce. - Sweep patterns. When an institution needs to execute urgently — ahead of a catalyst, or to establish a position quickly — they send large market orders that sweep multiple price levels simultaneously. When large orders hit multiple price levels simultaneously, institutional traders tend to execute urgent positions. In QuantFlows, this shows as a large Bubble Market Dot — or a rapid sequence of them — printing across several levels in milliseconds, with CVD spiking sharply and the heatmap ask stack thinning visibly as levels get consumed.
- Time-distributed volume at a level. TWAP execution produces a distinctive fingerprint in CVD: a slow, consistent upward drift over hours without a single large spike. Price moves sideways. OI builds incrementally. The bid side of the heatmap gradually thickens. No single candle is notable. The aggregate tells a different story — sustained buying across a window that's too consistent to be random retail flow.
Accumulation vs Distribution: Reading the Phase
The practical question isn't just "is an institution active?" — it's "are they buying or selling?" Accumulation and distribution produce mirror-image patterns in order flow, and distinguishing them determines whether you're positioning alongside the institutional move or against it.
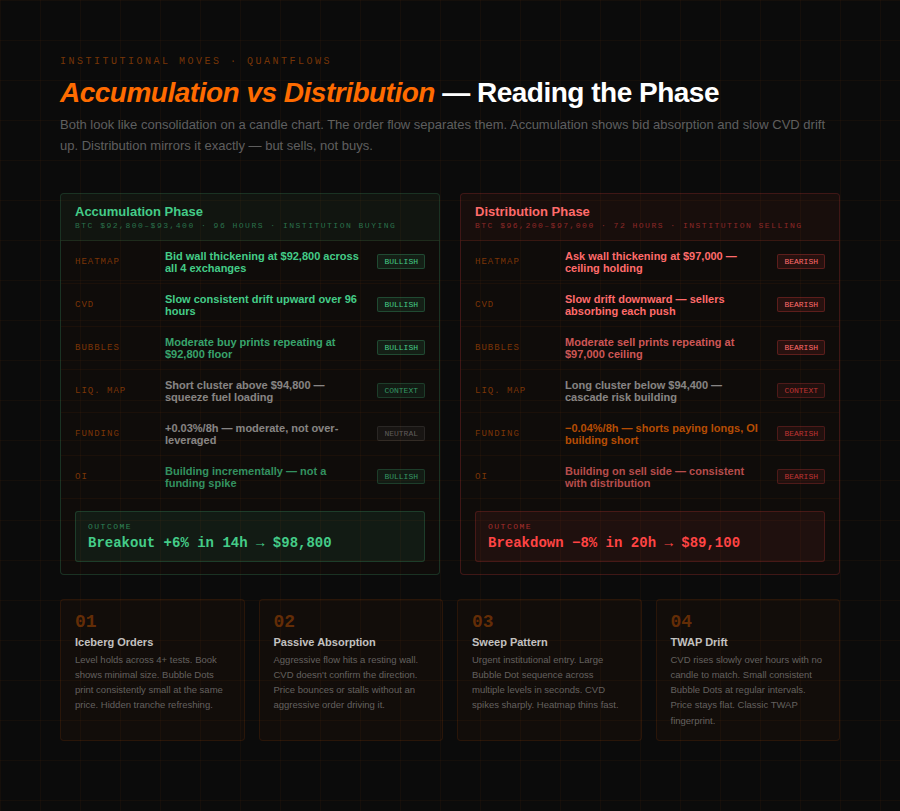
Accumulation builds over time below a resistance level. The heatmap bid stack thickens at a key zone. CVD drifts upward slowly. Bubble Market Dots show moderate buy prints at the same level across multiple sessions. Price grinds sideways with shallow dips that recover quickly. Open interest builds incrementally — funding rates stay moderate, which means the position isn't so leveraged that it's feeding on itself. The four-day BTC consolidation between $92,800 and $93,400 fit this profile exactly: bid wall reinforcing at $92,800, slow CVD drift, Bubble Dots showing consistent buy-side activity at the floor.
Distribution looks identical from a distance but reverses on inspection. A dense ask wall holds each attempt to rally. CVD drifts downward despite apparent price stability. Bubble Market Dots show sell-side prints at the ceiling. Open interest builds but funding goes negative — shorts paying longs — which means the building OI is on the sell side. Price holds a range but the ceiling is firm in a way that's structurally different from the range bottom: the bid recovers from dips, but the ask absorbs every push higher without thinning.
The distinction matters because both patterns can look like "consolidation" on a candle chart. The order flow separates them. QuantFlows showing bid-side absorption and gradual CVD drift up is accumulation. The same setup with ask-side absorption and CVD drifting down is distribution.
What to Do With the Read
Identifying institutional activity is not a standalone trading signal. An institution accumulating doesn't mean price moves immediately — accumulation can extend for days or weeks before a catalyst triggers the move. The edge is in positioning structure, not entry timing.
Three applications matter in practice.
- First, stop placement: if a bid wall is holding through repeated tests and Bubble Dots confirm absorption at that level, a stop just below the wall has an institution defending it. That's structurally different from a stop in an empty zone.
- Second, directional bias: slow CVD drift up with bid-side absorption tells you who's been winning the book over the past several sessions, even when price has gone nowhere.
- Third, breakout conviction: when price finally breaks out of an accumulation range, the prior order flow context tells you whether to chase it or fade it. A breakout from 96 hours of confirmed institutional accumulation — bid absorption, iceberg refresh, consistent CVD drift — is a structurally different trade from a breakout through an air pocket.
Crypto derivatives trading volume reached $85.7 trillion in 2025, with CME Group overtaking Binance in BTC futures — institutional dominance in crypto markets is no longer a thesis. It's the operating reality. Institutions are the liquidity at key levels.
They're the orders defending floors and capping rallies. Reading them isn't an edge reserved for desks with MBO data feeds — it's a skill built from understanding what passive absorption, iceberg refresh, and consistent TWAP flow look like in the heatmap, CVD, and tape.
QuantFlows aggregates all four data layers — heatmap, CVD, liquidation clusters, and Bubble Market Dots — live across Binance, Bybit, OKX, and Hyperliquid. Free during beta at quantflows.xyz.