A $90M bid wall appears at $94,200. It's been sitting there for four seconds — enough time to register as support. You go long. The wall evaporates before your order fills. Price drops straight through $94,200 to $93,600, sweeps your stop, and bounces. The wall was never real. It was bait, placed and pulled by an algorithm operating in milliseconds, designed to induce exactly the behavior you just exhibited.
This is layering — one of several HFT strategies that run continuously in crypto futures markets — and it corrupts every naive order flow read that doesn't account for it. High-frequency trading firms now account for a significant portion of order book activity across Binance, Bybit, OKX, and Hyperliquid. The heatmap you're reading is partially generated by machines that have no intention of trading at the prices they're quoting. Knowing which signals to trust and which to filter is what separates order flow analysis from order flow noise.
What HFT Actually Does in Crypto Markets
High-frequency trading uses co-located servers, direct market connections, and algorithms operating in microseconds to execute strategies that exploit tiny, fleeting edges across venues. In traditional markets, HFT accounted for 60% of US equity volume by 2010. In crypto, while exact figures are opaque, exchange order books show unmistakable HFT patterns: order-to-trade ratios far exceeding anything a human trader could generate, walls that appear and vanish in under 100 milliseconds, and spread compression that tightens and widens in sync with volatility spikes.
HFT in crypto operates primarily through four strategies, each of which affects order flow data in specific and distinguishable ways.
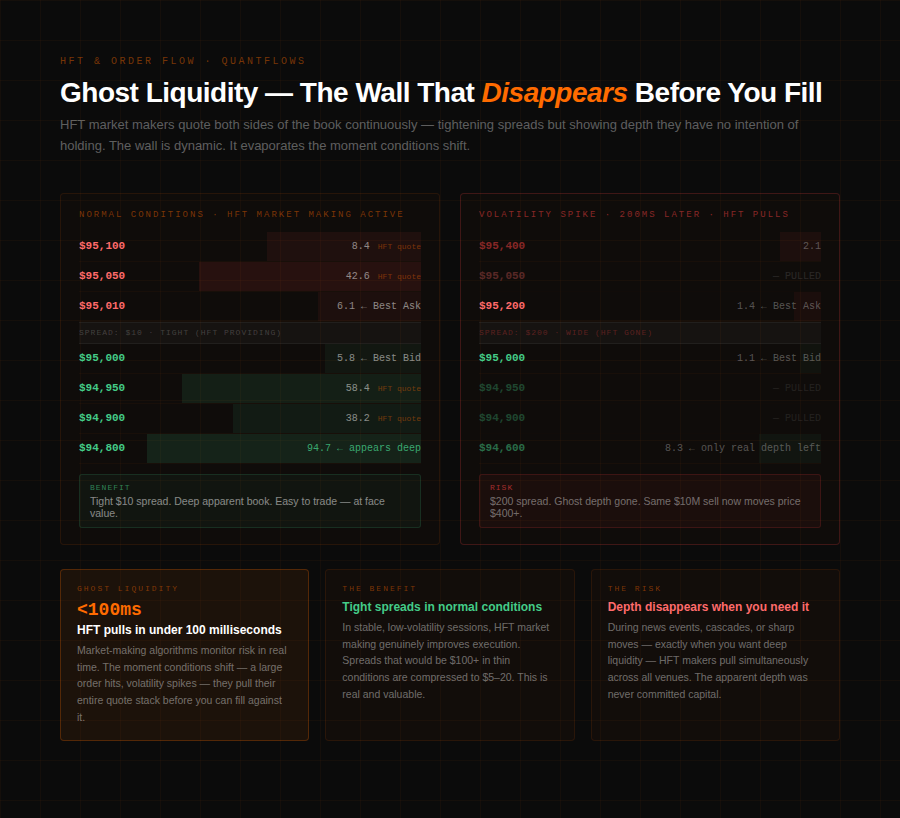
- Market making. The most common and broadly beneficial HFT activity. Market-making algorithms quote both sides of the book simultaneously — bids below and asks above — earning the spread on each transaction that fills against them. They provide liquidity continuously, which tightens spreads and makes the market easier for everyone to trade. The catch is ghost liquidity: because market-making algorithms dynamically adjust their quotes based on real-time risk metrics, the depth they show can vanish instantly the moment conditions change. A $40M ask wall from a market maker isn't a committed seller — it's a dynamic quote that disappears the moment the algorithm decides the risk has shifted. In QuantFlows, this manifests as heatmap zones that flicker or thin rapidly without price reaching them.
- Latency arbitrage. HFT firms exploit the microsecond delay between when price moves on one exchange and when that information propagates to another. If BTC lifts on Binance, a latency arbitrageur can sell on Bybit before Bybit's book has adjusted, locking in a near risk-free spread. This doesn't generate false signals directly, but it does mean the cross-exchange depth data QuantFlows aggregates is momentarily inconsistent after sharp moves — one exchange's book reflects new prices while another lags. Those temporary inconsistencies explain some of the erratic heatmap behavior in the first 200–500 milliseconds following a sharp price move.
- Quote stuffing. A more predatory strategy involving flooding the order book with thousands of orders per second, then canceling them immediately. The goal is to overwhelm the processing capacity of competing algorithms, creating delays that the quote stuffer then exploits. For retail traders, quote stuffing manifests as heatmap zones that flash in and out rapidly with no corresponding price movement or execution. The order book appears extremely active but no trades are printing. This is one of the more identifiable HFT signals in QuantFlows: high apparent depth with near-zero Bubble Market Dot activity at those levels.
- Layering. The strategy in the opening scenario. Layering involves placing large visible orders to create the impression of strong support or resistance, then canceling them before execution when other traders react to them. Unlike spoofing (which typically involves single large orders), layering uses multiple stacked orders at adjacent price levels to make the false support look more credible. The regulatory grey area in crypto means layering is widespread on unregulated venues.
What HFT Patterns Look Like in the Heatmap
Quote stuffing and layering produce specific visual patterns in the heatmap that differ from genuine resting liquidity. Learning to distinguish them changes how you interpret wall strength before entering a position.
Genuine resting liquidity behaves consistently. A $60M bid wall from an institutional limit order sits at a level and holds as price approaches. Bubble Market Dots register fills as the wall is tested — real orders trading against real selling pressure. The wall may thin gradually as it absorbs flow, then partially refresh. The key characteristic is execution: real orders leave a trace in the tape.
HFT layering looks similar at first glance but behaves differently. The tell is the disappearance pattern. A layered wall pulls cleanly — often across multiple adjacent levels simultaneously — before any fills register. In QuantFlows, the sequence is: heatmap zone brightens as the stack appears, Bubble Dots stay absent (no execution at those levels), price approaches the zone, the heatmap zone evaporates before contact. The order vanished without trading against anything.
Quote stuffing is even more identifiable. The heatmap flickers rapidly — zones appearing and disappearing across multiple levels with high frequency — while the price barely moves and Bubble Dots show minimal activity. The book looks extremely busy. Nothing is actually happening. CVD stays flat because no aggressive orders are executing against the noise. If you see a busy heatmap with low CVD activity and minimal Bubble Dots, you're looking at algorithmic noise, not tradeable liquidity.

Filtering HFT Noise From Real Signal in QuantFlows
The practical challenge is that HFT activity and genuine order flow coexist in the same data stream. The heatmap is never purely one or the other — it's a mix. The tools that filter signal from noise are execution confirmation, CVD, and persistence.
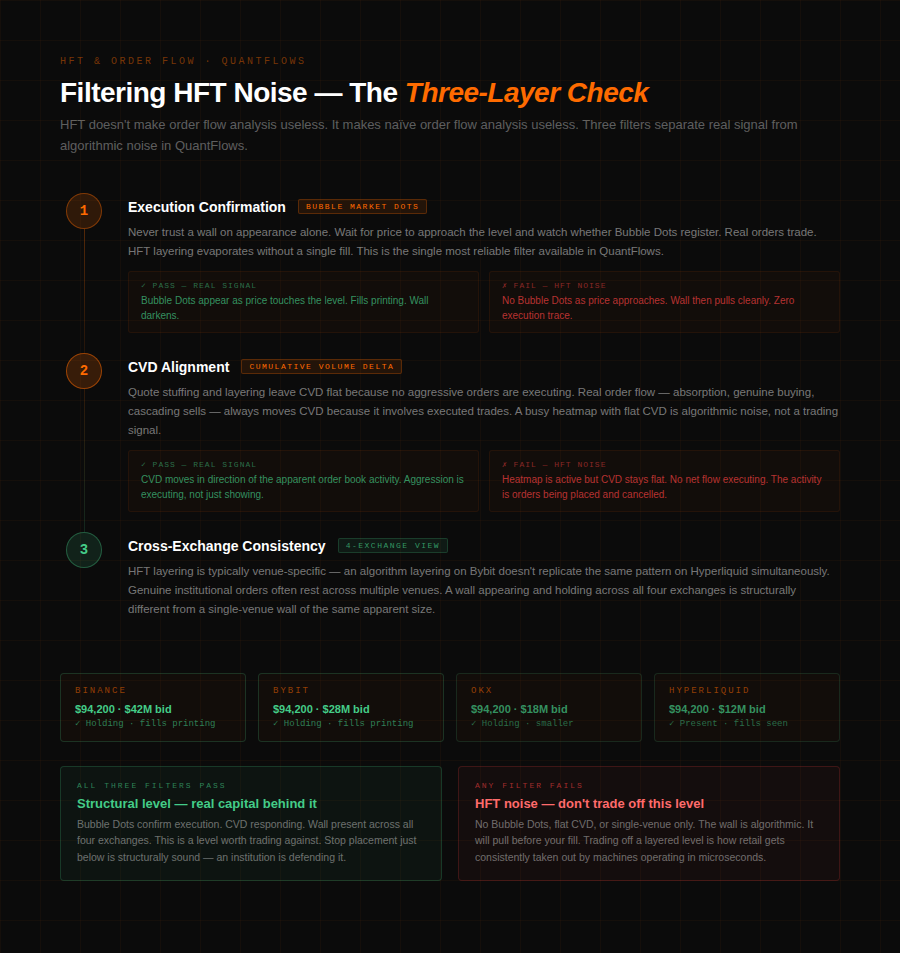
- Execution confirmation via Bubble Market Dots. Real liquidity trades. If a wall is being tested by genuine selling pressure and the wall is genuine, Bubble Market Dots print at that level — real trades executing against real resting orders. A wall with no Bubble Dots as price approaches is a strong indicator it's HFT-generated and will pull. This is the most reliable single filter in QuantFlows: demand persistence plus execution at the level.
- CVD alignment. HFT strategies that don't involve actual aggressive order flow leave CVD unmoved. Quote stuffing floods the order book with cancelled orders — no net change in executed buy or sell volume, so CVD stays flat. Genuine aggressive buying drives CVD up. If the heatmap shows heavy apparent activity but CVD isn't moving in any direction, the activity is generated noise. Real market structure — whether institutional absorption, aggressive buying, or a genuine cascade — always moves CVD because it involves executed trades.
- Wall persistence under pressure. Genuine resting orders hold as price approaches and start producing fills — the wall darkens as it's consumed. An HFT layered wall disappears before consumption. A simple rule: if the heatmap zone brightens significantly and then vanishes as price moves toward it without any Bubble Dots appearing, that wall was never real. A wall that holds through multiple tests, darkens from fills, and partially refreshes is genuine and structurally significant.
QuantFlows applies these filters simultaneously across Binance, Bybit, OKX, and Hyperliquid. Because HFT layering tends to be exchange-specific — an algorithm layering on Bybit doesn't typically replicate the exact same pattern on Hyperliquid in the same millisecond — cross-exchange consistency adds a fourth filter. A wall that appears and holds across all four exchanges simultaneously is far more likely to be genuine than one that exists only on a single venue.
Practical Workflow Around HFT-Affected Markets
Three adjustments to standard order flow reading account for HFT presence.
First, never trade the first appearance of a wall. Let price approach it and watch whether Bubble Dots register. A wall that produces zero fills as price reaches it is almost certainly HFT and will pull. Wait for execution confirmation before trusting any heatmap level as structural support or resistance.
Second, use CVD as the ground truth. HFT strategies that don't involve genuine aggressive order flow leave CVD flat. If the heatmap is busy but CVD isn't moving, the market isn't actually doing anything directional — algorithms are generating activity without creating net flow imbalance. Treat flat CVD during a busy heatmap as a neutral environment, not as a trading signal.
Third, weight cross-exchange confirmation. When the same bid cluster appears and holds across Binance, Bybit, OKX, and Hyperliquid simultaneously, the probability of it being HFT noise drops sharply. Genuine institutional orders often rest across multiple venues — HFT layering tends to be venue-specific. A four-exchange confirmed bid wall is structurally different from a single-venue wall of the same apparent size.
HFT doesn't make order flow analysis useless. It makes naïve order flow analysis useless. The traders getting baited by disappearing walls are reading the heatmap without filtering for execution. The traders reading CVD alongside the heatmap, watching Bubble Dots for confirmation, and cross-checking across exchanges are reading the actual market — the part of the order book that has real money behind it.
QuantFlows renders the full order flow picture — heatmap, CVD, Bubble Market Dots, and liquidation clusters — live across Binance, Bybit, OKX, and Hyperliquid simultaneously. Free during beta at quantflows.xyz.