On February 1st, 2026, over 335,000 futures traders got liquidated in a single day. Bitcoin dropped below $76,000. More than $2.2 billion in leveraged positions were wiped out in under 24 hours.
The traders who lost money that day weren't necessarily wrong about the direction of the market — they were wrong about how much room their positions had to breathe. That distinction is everything in futures trading, and it starts with understanding what crypto liquidation actually is, mechanically, not conceptually.
What Crypto Liquidation Actually Means
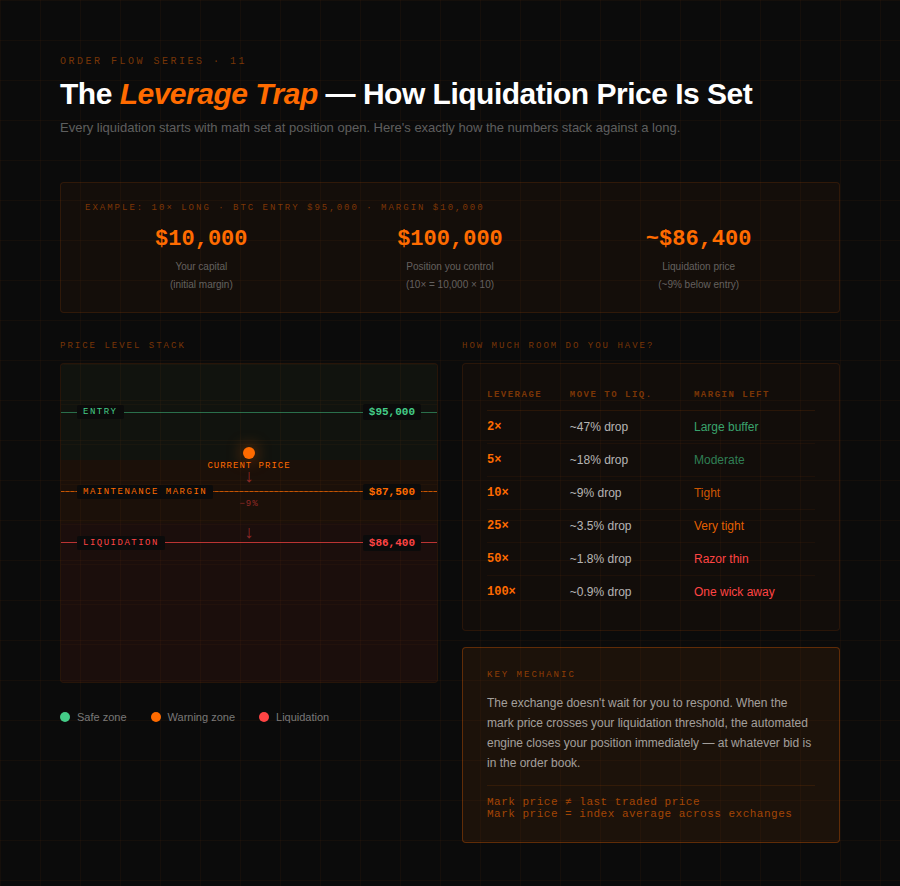
When you open a leveraged futures position, you don't own the underlying asset. You control a position many times larger than your capital using borrowed funds from the exchange. That borrowed purchasing power comes with a condition: if the market moves against you beyond a specific threshold, the exchange automatically closes your position to recover what you owe. That forced closure is a crypto liquidation.
The math is unforgiving. With 10x leverage on a $10,000 BTC long, you control a $100,000 position using $10,000 as margin. A 10% drop wipes your margin entirely. In practice it hits slightly before that — exchanges have maintenance margin requirements that trigger liquidation before you reach zero — but at high leverage, the entire buffer is measured in percentage points, sometimes fractions. One wick in the wrong direction and the position is gone.
Unlike traditional markets where a broker might call you and ask for more collateral, crypto exchanges don't wait. There are no phone calls, no grace periods. The liquidation engine is automated and runs continuously. When the mark price — the exchange's calculated fair value, averaged across reference exchanges to reduce manipulation — crosses your liquidation threshold, the engine acts immediately. Your position is closed at market price and your remaining margin is gone.
The Cascade: When One Forced Sell Becomes Ten Thousand
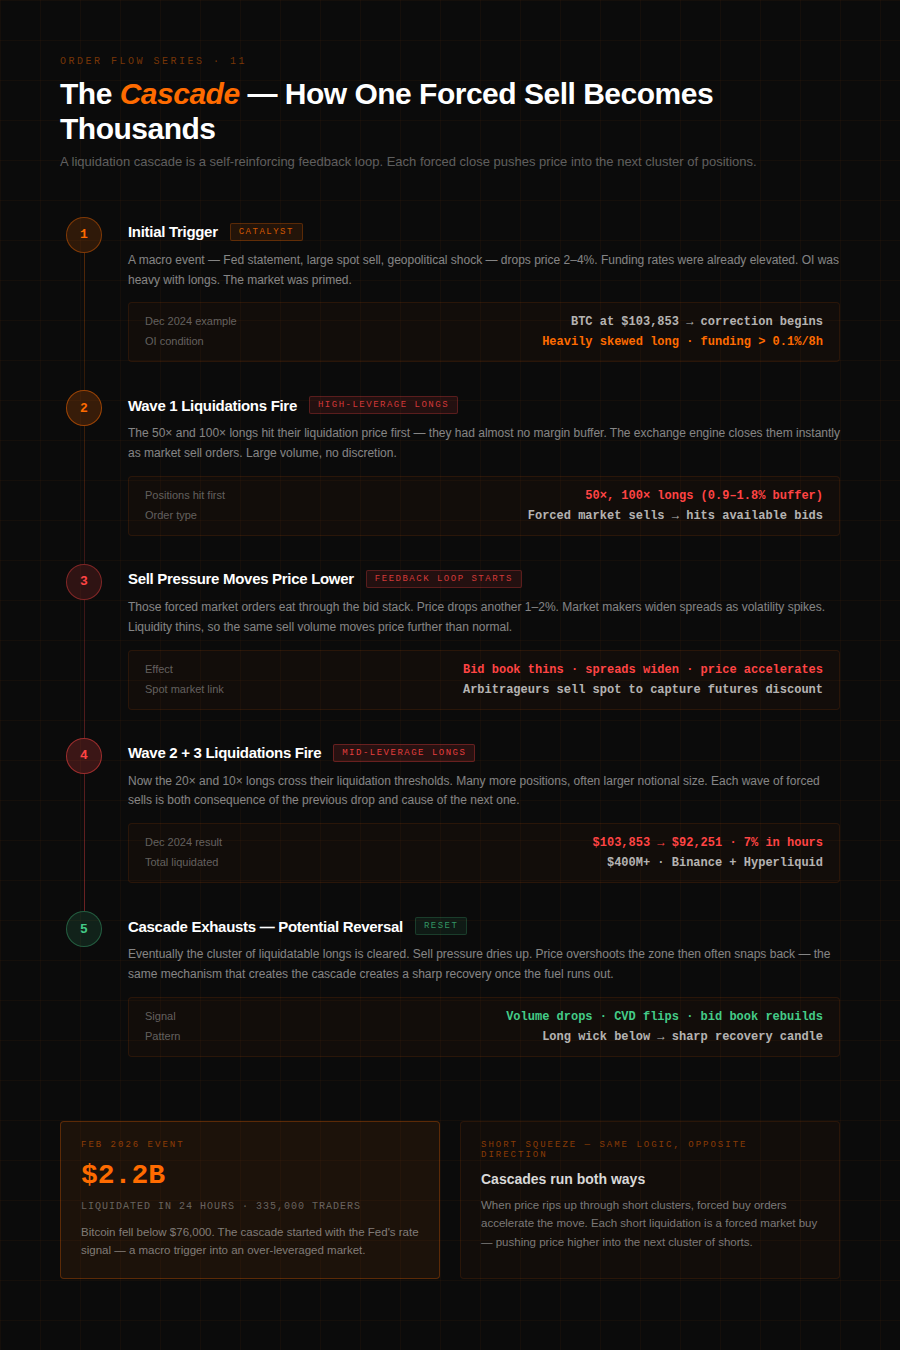
A single liquidation is just a bad trade. What matters to the market — and to every other trader in it — is what happens when thousands of liquidations cluster at the same price level.
Picture BTC trending up, funding rates elevated, open interest heavy with longs. A macro event — a Fed statement, a geopolitical shock, a large spot sell — drops the price 4%. That move liquidates the most aggressively leveraged longs first: the 50x and 100x positions that had almost no buffer.
Those forced sells are market orders. They hit the order book at whatever price is available, creating immediate downward pressure. That pressure moves the price lower. That lower price now crosses the liquidation threshold for the next layer of traders — the 20x and 25x positions. Those liquidate, driving price down further, tripping the 10x traders, and so the loop runs. Each wave of liquidations is both the effect of the previous drop and the cause of the next one.
In December 2024, this exact mechanism took Bitcoin from $103,853 to $92,251 — a 7% flash crash that liquidated over $400 million in leveraged positions, primarily on Binance and Hyperliquid. The original trigger was a modest correction in an already over-leveraged market. The cascade did the rest.
The futures market doesn't stay isolated either. As futures prices crash below spot prices due to cascading forced sells, arbitrageurs step in. They buy cheap futures and simultaneously sell the equivalent on spot markets — locking in a risk-free spread.
That spot selling transmits the futures liquidation event directly into spot price, turning what started in derivatives into a market-wide move. This is why a cascade in BTC perps can be felt across altcoins, across spot, and across the entire market cap within minutes.
Short squeezes run the same engine in reverse. Price rips up through a cluster of short positions, those traders get liquidated — forced to buy to close — and that forced buying accelerates the move into the next cluster of shorts above. The July 2025 Hyperliquid whale "Qwatio" found this out when a concentrated short position in a market carrying over $5 billion in open interest got squeezed violently. The mechanism doesn't care about direction.
Reading Liquidation Clusters Before Price Gets There
Most traders only see a liquidation after it hits — a sharp wick, a sudden candle, a position that's already gone. What changes the game is knowing those levels sit on the chart before price gets there. Because exchanges track every leveraged position, and open interest data is partially public, it's possible to map where large clusters of longs and shorts will be force-closed if price reaches them.
This is what a liquidation heatmap shows. Bright zones on the map — yellow or orange depending on the platform — indicate dense concentrations of positions that would be liquidated at that price. Below current price, those are typically long liquidations: forced sells waiting to be triggered. Above current price, they're typically short liquidations: forced buys waiting to fire.
These zones behave like magnets. Price doesn't always respect traditional support and resistance because those levels are drawn from historical price action. Liquidation clusters represent current, live positioning — real money that will move the order book the moment price touches it. When a large cluster sits just below a key support level, that support is not neutral ground. It's a trap with a hair trigger.
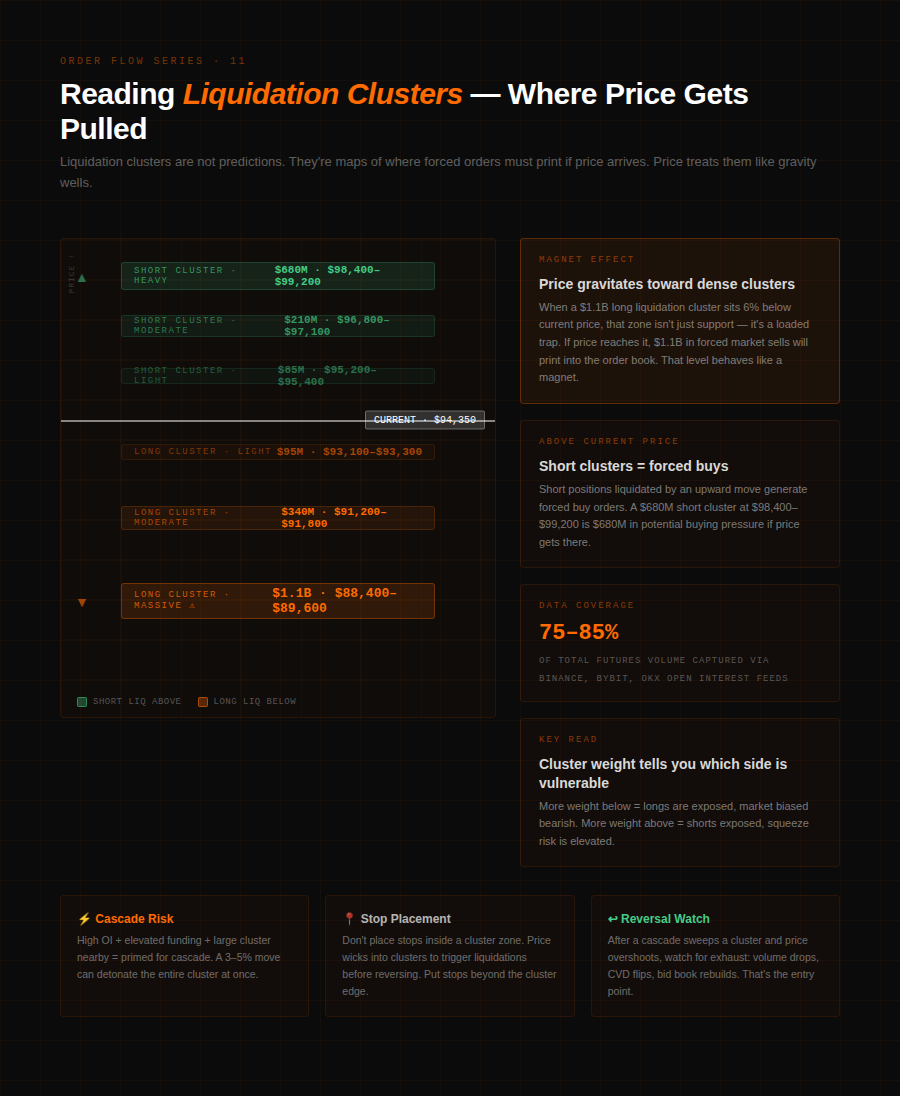
The practical application is not to predict where price is going — no tool does that reliably — but to understand what will happen mechanically if price gets to a certain level. A dense long liquidation cluster 4% below current price means that a move to that level won't just be a slow drift down. It will accelerate. Traders who know this either avoid having stops inside the cluster (because they'll get swept) or position to trade the exhaust point after the cascade clears.
High open interest combined with elevated funding rates is the setup that makes clusters especially dangerous. When funding is persistently positive — meaning longs are paying shorts to hold their positions — the market is heavily skewed in one direction. That skew concentrates liquidation risk on one side. A moderate counter-move in a high-OI, high-funding environment can detonate that entire side of the market at once.
The Candle Doesn't Show You Any of This
Most traders only see a liquidation after it hits — a sharp wick, a sudden candle, a position that's already gone. The $400 million in long liquidations that drove Bitcoin's December 2024 flash crash look like a sharp bearish candle on a standard chart. Nothing more. The mechanism underneath — cascading forced sells, arbitrage transmission into spot, a bid book in freefall — is completely invisible unless you're watching liquidation data alongside price.
When you can see real-time liquidation events layered over price action, moves that look random start having structure. A wick that sweeps a low and reverses sharply isn't noise — it's a cascade that exhausted itself. A breakout that stalls at a level with a dense short cluster above it isn't a failed breakout — it's a squeeze waiting for enough buying pressure to ignite.
QuantFlows displays live liquidation clusters across Binance, Bybit, OKX, and Hyperliquid simultaneously — alongside CVD, the heatmap, and Bubble Market Dots — so you see the full picture in one place. Free during beta at quantflows.xyz.