Key Takeaways
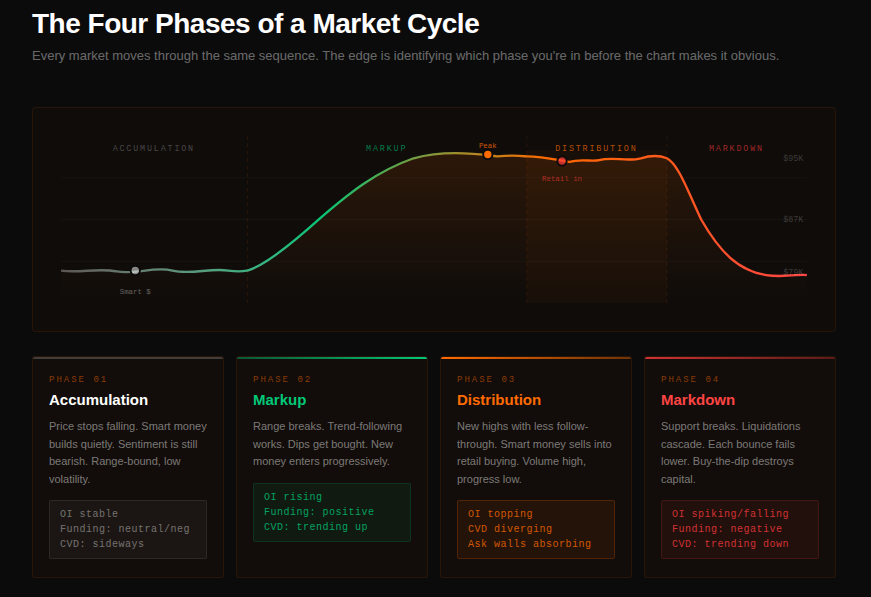
- Crypto market cycles move through four phases — Accumulation, Markup, Distribution, Markdown — and each one looks completely different from the inside than it does labeled on a chart in hindsight.
- The transition between phases, not the phase itself, is where most traders lose money, because the same candle pattern means opposite things depending on context.
- Order flow — CVD divergence, open interest behavior, how the book absorbs aggression — tells you which phase you're in before the price chart confirms it.
- Crypto cycles compress and amplify versus traditional markets because leverage turns directional moves into liquidation cascades.
- Knowing the phase changes which trades are available — the same breakout setup has opposite expected value in markup versus distribution.
A crypto market cycle moves through four repeating phases — Accumulation, Markup, Distribution, and Markdown — and the order flow underneath each phase reveals where price actually is in that sequence before the chart confirms it. Most retail losses come not from misreading the trend, but from misreading which phase of it they're standing in.
You've been in this trade. Price has been grinding up for eleven days straight. Every dip gets bought. Sentiment is loud — crypto Twitter is calling six figures, every influencer has a price target. You're already long and you add more exposure because the momentum feels unstoppable.
Then it stops. Not with a crash — with a slow, grinding chop that goes nowhere for two weeks. Then a sharp leg down that feels like a shakeout. You hold through it. Then another leg down. By the time you accept what's actually happening, you've given back most of the run.
You weren't wrong about the trend. You were wrong about where you were in it.
Market cycles don't announce themselves. They reveal themselves in the structure of price, the behavior of participants, and — if you know where to look — in the order flow underneath the candles.
What Is the Crypto Market Cycle?
The four-phase model — Accumulation, Markup, Distribution, Markdown — comes from the Wyckoff Method, a framework developed in the early 1900s for equities that crypto traders have adopted almost unchanged. According to BitMEX, the method rests on a single abstraction: all price movement reflects the actions of one "Composite Operator," useful shorthand for understanding institutional supply and demand. The theory is simple. The application is not, because each phase looks completely different from the inside than it does labeled on a chart in hindsight.
Accumulation
This is the phase most retail traders miss entirely. Price has been falling for weeks or months. Sentiment is awful. Volume is thin. But underneath the surface, something is changing.
Large participants start building positions quietly. They buy dips without pushing price up aggressively, absorbing sell pressure without triggering the kind of momentum that draws attention. Per BitMEX, accumulation occurs at market bottoms, where institutions absorb retail panic-selling before a markup begins — the mirror image of distribution at the top.
The defining feature of accumulation isn't price going up. It's price stopping going down while volume stays controlled.
In crypto futures terms: BTC sitting in a $4,000 range for six weeks after a 40% correction, funding rate neutral or slightly negative, open interest stable. The chart looks boring. That's the point.
Markup
Markup is where the move becomes visible. Early participants who accumulated start seeing their thesis confirmed. Price breaks above the range, and new buyers enter — first cautiously, then aggressively as momentum builds. CoinLaw notes that during markup, prices rise steadily, often with increased volume, as narratives broaden from a single asset into large-cap alts, then mid-caps, then speculative themes.
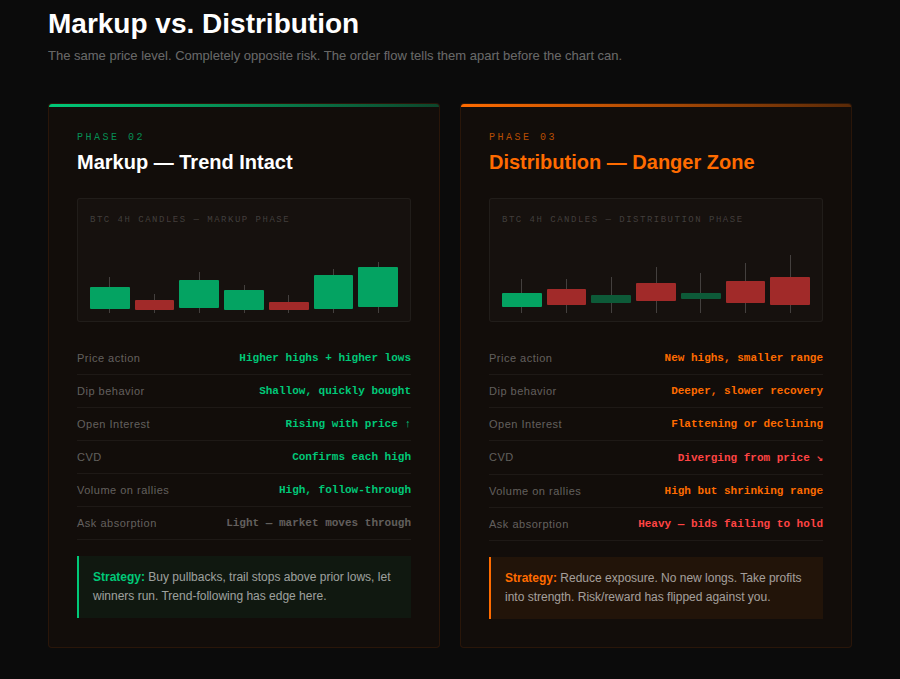
This is the phase where trend-following works cleanly, where breakouts follow through, where adding to winning positions makes sense. The order flow characteristic here is consistent: aggressive buyers eating through ask-side liquidity at each new high, CVD trending upward, open interest expanding as new longs build.
The problem is that most retail traders don't enter during accumulation or early markup. They enter late — during the phase that looks most convincing but carries the most risk.
Distribution
This is the trap phase. Price is near the highs. Sentiment is euphoric. Volume is high — but the nature of that volume has changed. Smart money that accumulated at the lows is now selling into the strength, carefully offloading to the retail buyers flooding in.
Price still makes new highs, but they come with less conviction. The rallies get shorter. The dips get slightly deeper. Range-bound chop develops at the top.
The order flow tells you before the chart does. CVD starts diverging from price — price makes new highs but CVD doesn't confirm. Ask walls appear and get absorbed without price following through upward. Bids that previously got swept through now hold. The structure of the book changes before the price chart gives the signal.
Markdown
This is when the cycle completes. The selling accelerates. Longs who bought distribution get stopped out, adding forced selling to the pressure. The cascade triggers further liquidations. Price finds lower lows. At some point — and nobody rings a bell — accumulation begins again.
Why Crypto Cycles Compress and Amplify
Traditional market cycles can play out over years. Crypto compresses them into months, sometimes weeks, because the participant structure is different.
Leverage is everywhere. A significant portion of exposure in crypto futures isn't held conviction — it's borrowed capital with a liquidation price. When the cycle turns, over-leveraged longs don't just sell their positions. They get liquidated. This adds mechanical selling pressure on top of the directional selling, which triggers more liquidations, which cascades. The markdown phase in crypto hits faster and harder than fundamentals alone would justify.
The same dynamic works in reverse during accumulation. Shorts who built exposure during the downtrend get squeezed as price stabilizes. Their covering — mechanical buying — provides lift without reflecting new bullish conviction. This can look like the start of markup when it's actually just the end of markdown cleaning out short positions.
This is why cycle phase identification in crypto requires more than chart reading. The candles show you price. They don't show you whether that price movement is driven by conviction or mechanics.
Reading Phase Transitions in Real Time
The most valuable skill isn't identifying which phase you're currently in — it's catching the transition before the chart makes it obvious.
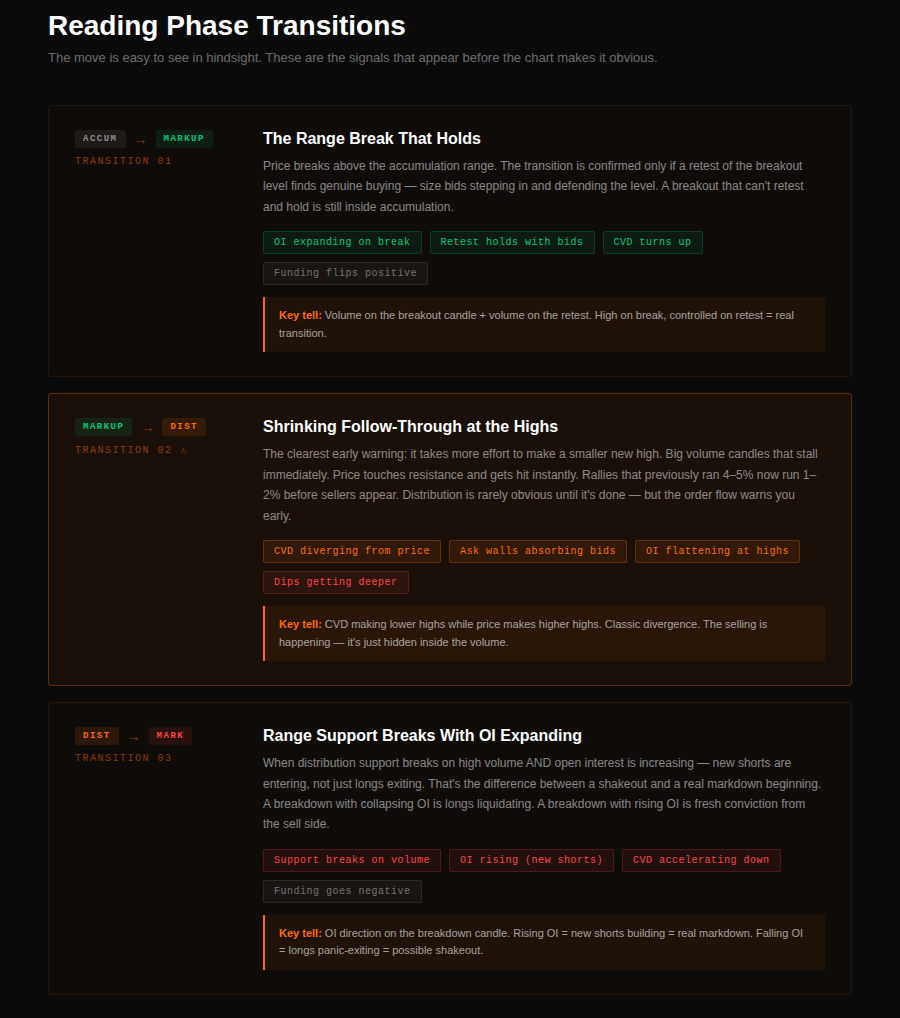
Accumulation to Markup transition: Watch for the first breakout above the range that holds on a retest. The key isn't the breakout itself — it's whether price comes back to test the breakout level and finds genuine buying. If bids step in at the breakout zone with real size and hold, new participants are defending price. That's markup beginning. If the retest slices through, you were looking at a fake breakout within distribution of a higher cycle.
Markup to Distribution transition: The warning is always in the effort required to make new highs. When price needs increasingly large volume to push through resistance, but the resulting move is smaller, distribution is likely underway. Big candles with shrinking follow-through. Volume spikes that resolve sideways rather than higher. In order flow terms: aggressive buying into the ask gets absorbed without creating sustained upside. Price grinds to a new high, sellers hit it immediately, and the level fails to hold.
Distribution to Markdown transition: This is where timing matters most. The first real breakdown below range support — with expanding volume and open interest increasing (new shorts entering, not just longs closing) — is the signal. The traders who hold through the first breakdown hoping it's a shakeout are the fuel for the markdown phase.
The Practical Playbook
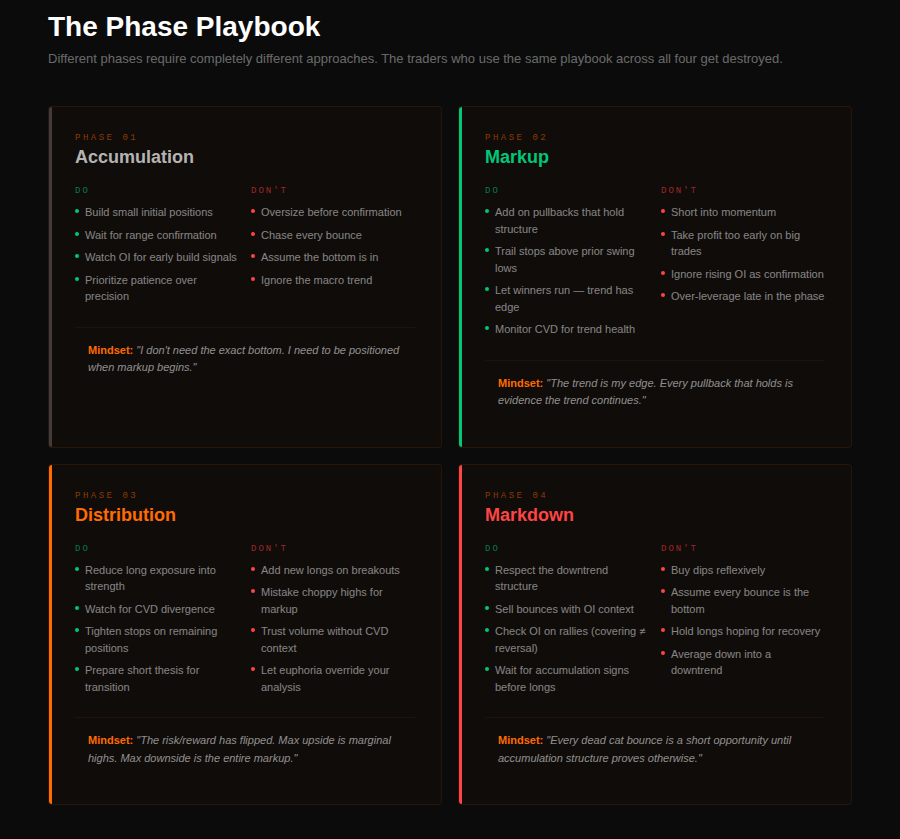
Different cycle phases require completely different approaches. The mistake most retail traders make is using the same playbook across all four phases.
During accumulation, the correct trade is patience over aggression. Positions should be sized conservatively because accumulation can extend far longer than anyone expects. The goal isn't to nail the exact bottom — it's to be positioned before markup begins. Breakout confirmation matters more than entry price.
During markup, trend-following works. Add to positions on pullbacks that hold structure. Trail stops above key lows. Don't fight momentum. The order flow characteristic to watch for is any session where aggressive selling can't push price below the prior day's low — that's markup intact.
During distribution, reduce exposure. Don't add to longs into strength. The risk/reward has flipped — the upside is marginal highs, the downside is the entire markup unwinding. If you're trading actively, this is the phase to take profits, not to build new exposure based on continued momentum.
During markdown, respect the trend. The buy-the-dip instinct that worked all through markup will destroy capital here. Each apparent reversal is a dead cat. The order flow signal to watch is any rally attempt that comes with declining OI — shorts covering, not bulls entering. Those rallies are selling opportunities, not reversals.
What Changes When You Map the Cycle
Most traders analyze markets horizontally — they look at what's happening right now, what the setup looks like, what the immediate resistance is. Cycle analysis forces a vertical perspective. Before asking "what's the trade?" you ask "where are we?" The answer to the second question determines which trades are available.
A breakout setup during markup and a breakout setup during distribution look identical on a one-hour chart. They have opposite expected values. The trader who can tell them apart — using cycle context, order flow confirmation, and the behavior of volume at key levels — is playing a fundamentally different game than the trader who sees only the candle pattern.
The cycle doesn't tell you when to trade. It tells you how to think about the trades you're already seeing.
FAQ
What are the four phases of the crypto market cycle?
The four phases are Accumulation, Markup, Distribution, and Markdown, drawn from the Wyckoff Method — a sideways absorption phase, a rising trend, a sideways top, and a falling trend that resets the cycle.
How do I know if the market is in accumulation or distribution?
Both look like sideways ranges, but accumulation follows a downtrend with thinning volume and stabilizing price, while distribution follows an uptrend with high volume and weakening follow-through on new highs.
Can order flow tell me which phase the market is in before price confirms it?
Yes — CVD divergence from price, changes in how the order book absorbs aggression, and shifts in open interest behavior typically show up before the chart structure breaks.
Is the Wyckoff Method still relevant for trading Bitcoin in 2026?
Yes — major Bitcoin tops and bottoms across multiple cycles have shown recognizable Wyckoff structures, and the framework remains widely used by crypto traders for cycle identification.
QuantFlows overlays real-time CVD, open interest, liquidation clusters, and live order book depth across Binance, Bybit, OKX, and Hyperliquid — giving you the order flow layer that makes cycle transitions readable before the chart shows them. Free during beta at quantflows.xyz.