Key Takeaways
- Open interest measures the number of futures contracts still open — not how many trades happened, but how much committed capital is still on the table.
- Rising price with falling open interest is a short-covering trap: the rally has no new buyers behind it and tends to reverse fast.
- Rising price with rising open interest is the cleanest signal — new capital is entering and backing the move.
- Crypto futures are especially prone to this trap because liquidation cascades produce sharp, OI-collapsing price spikes that look like reversals.
- Checking OI alongside price before entering a breakout separates a structurally supported move from a mechanical one.
Open interest is the total number of futures contracts currently open in a market — it rises when new buyers and sellers commit fresh capital, falls when positions close, and stays flat when an existing position simply changes hands. It is the one number that tells you whether a price move is backed by real conviction or just temporary repositioning by traders who are already exiting.
BTC breaks above $87,000. Volume spikes. The chart looks clean — higher high, strong close, textbook breakout structure. You enter long. An hour later the candle reverses and you're stopped out for -1.8%.
Nothing broke on the chart. The setup was real. So what happened?
The move had no commitment behind it. Price ran up, but the traders who were short simply bought back their positions and left. No new bulls entered. No fresh capital arrived. The chart showed what happened. It had no way to show who was responsible for it.
That gap is exactly what open interest closes.
What Is Open Interest in Crypto Futures?
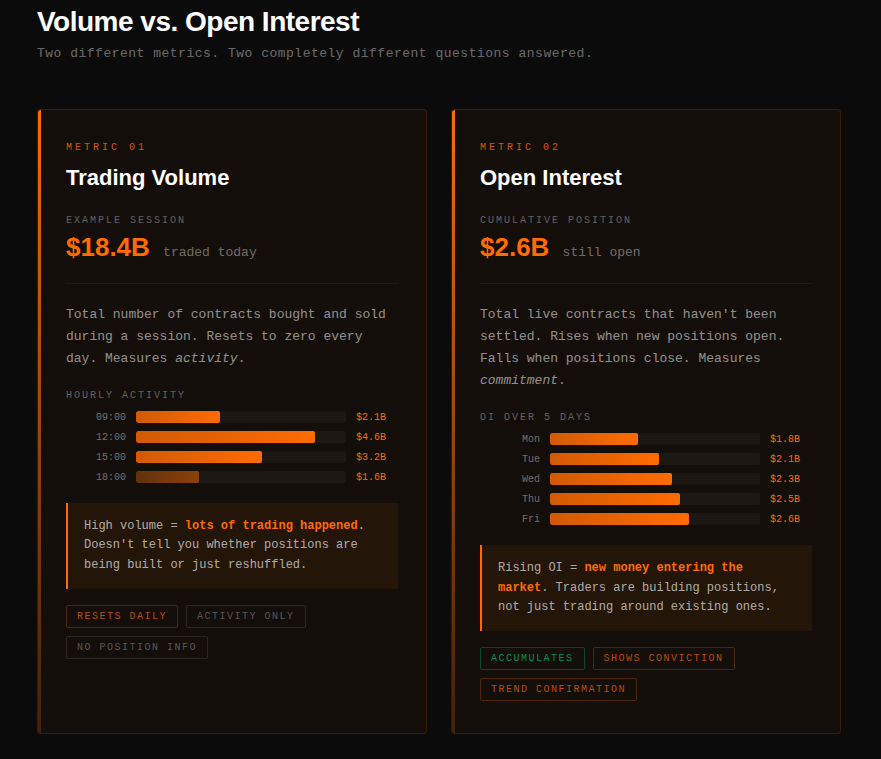
Open interest is the total number of futures contracts that are currently live in the market, and it works differently from volume in a way most traders never learn.
When a new buyer and a new seller create a contract together, open interest rises by one. When both sides close their positions, open interest falls by one. When an existing position simply changes hands — one trader exits and another takes their place — open interest stays exactly the same. According to Cube Exchange, open interest rises when a buyer and seller both enter into a new contract and falls when an existing long and an existing short close out that contract, while a transfer between traders typically leaves the total unchanged.
This is the mechanic that matters: open interest doesn't measure activity. It measures commitment.
On a busy session, BTC perps across major exchanges might print $18B in volume while open interest sits at $2.6B. That $18B includes every scalp, every hedge, every round trip made during the day. The $2.6B is what's still on the table — positions that haven't closed, capital that hasn't left.
How Does Open Interest Differ From Volume?
Here's a scenario most futures traders have lived through without knowing why it happened.
Price dumps hard. Volume is enormous — two or three times the daily average. You read it as sellers in control. But open interest drops 15% at the same time. That's not sellers pressing. That's longs liquidating and shorts covering simultaneously, both sides running for the exit. According to Britannica Money, when volume increases but open interest stays flat or falls, traders may be liquidating old positions or covering shorts rather than initiating new ones — exactly the churn that marks the tail end of a move rather than the start of one.
Now change one variable. Same price drop, same candle, same volume — but this time open interest rises 12%. New shorts are entering at these lower prices. Fresh capital is actively betting on further downside. This is a bearish move with structural support behind it, and it's far more likely to extend.
Same price action. Same candle. Two completely different market realities sitting underneath it.
The Four Market States Every Trader Should Know
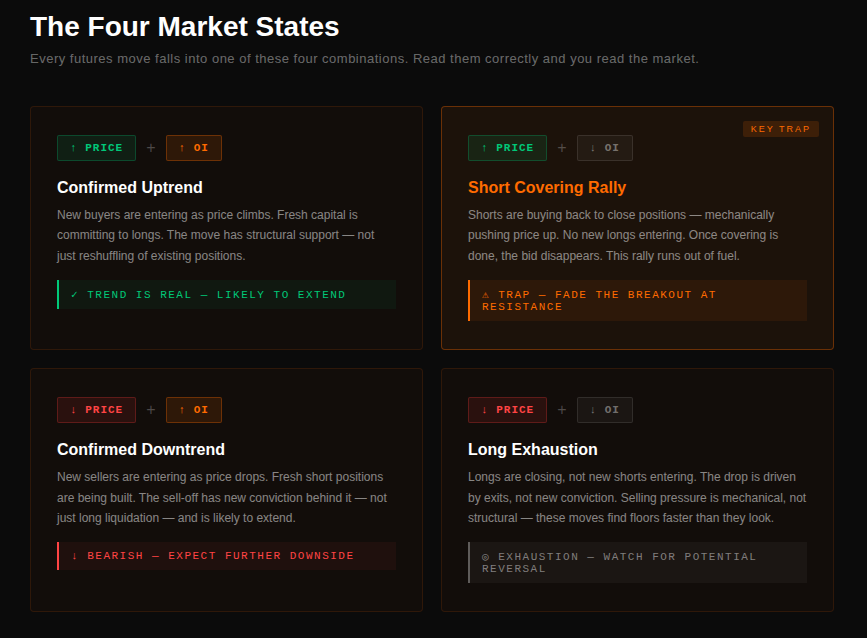
There's a simple matrix built from two variables — what price is doing, and what open interest is doing alongside it. The combinations produce four distinct states, and traders across both traditional and crypto futures markets rely on the same framework.
- Rising price + rising OI: Rising price with rising open interest is the cleanest read. New buyers are entering as price climbs, meaning the uptrend has fresh capital behind it. Per m.Stock, rising open interest alongside climbing prices usually signals a bullish trend with fresh buying taking place — about as close to a structural green light as this matrix produces.
- Rising price + falling OI: Rising price with falling open interest is the trap. Shorts are covering — buying back contracts to close losing positions — which mechanically pushes price higher without a single new buyer showing up. As Bookmap notes, falling open interest even as prices rise often signals weakening momentum or short covering, hinting at a possible trend reversal. Once the covering is finished, the bid disappears.
- Falling price + rising OI : Falling price with rising open interest is the bearish move with real teeth. New sellers are actively building fresh short exposure rather than closing out longs. m.Stock explains that when open interest rises as prices are falling, it suggests short positions are being added, indicating bearish sentiment — pressure that tends to extend because new supply is entering, not just old demand leaving. Reading this alongside CVD gives you a second confirmation: aggressive sell-side volume backing the same move.
- Falling price + falling OI: Falling price with falling open interest is exhaustion, not continuation. Price and open interest falling together points to long unwinding rather than fresh short conviction, and these drops tend to find a floor faster than the candle suggests.
Why Crypto Futures Are Especially Vulnerable to the Short-Covering Trap
Crypto futures are uniquely exposed to the rising-price, falling-OI setup because of how liquidation cascades behave. According to MetaMask News, a liquidation cascade is a chain reaction where forced closures push prices to levels that trigger further liquidations, amplifying volatility as liquidity providers step back and order book depth shrinks.
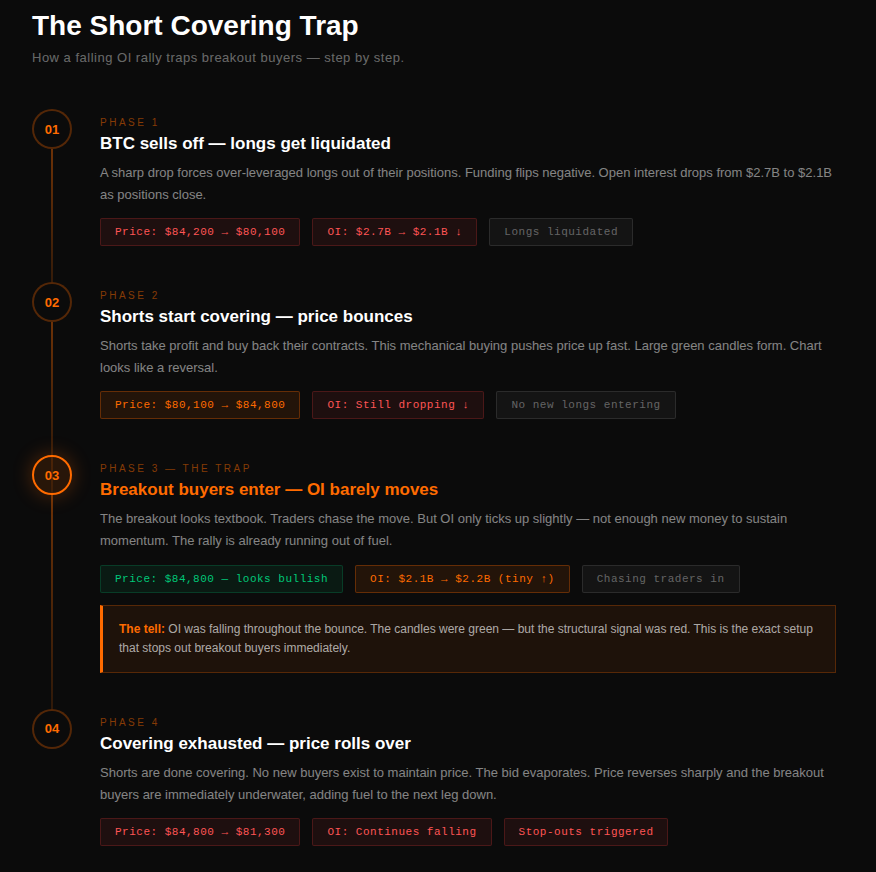
BTC sells off sharply. Long positions get liquidated, and open interest drops. Then the market snaps back — short positions start getting squeezed, and the covering pushes price up fast, producing large green candles that pattern-read as a reversal. Traders who chase the move enter long.
Then the squeeze exhausts. The shorts are covered. No new buyers arrive to sustain it. Price rolls over, and the longs who chased it are immediately underwater.
"In crypto perps markets, both buying and selling are equally easy. This creates perfect conditions for emotional, impulsive trading." — Arthur Hayes, BitMEX founder, as cited by Kingfisher
The tell is always in open interest during the initial phase of the move. If OI was contracting while price spiked, the rally was mechanical — driven by position closing, not by directional conviction. If OI was expanding during that same run, real participants were behind it.
Platform-observed pattern: on QuantFlows, the cleanest version of this setup shows up as a sharp green candle on the price chart paired with a flattening or declining OI line and a simultaneous spike in liquidation cluster density just below the prior swing low — three data points telling the same story before the reversal candle even closes.
How to Use Open Interest Before You Enter a Trade
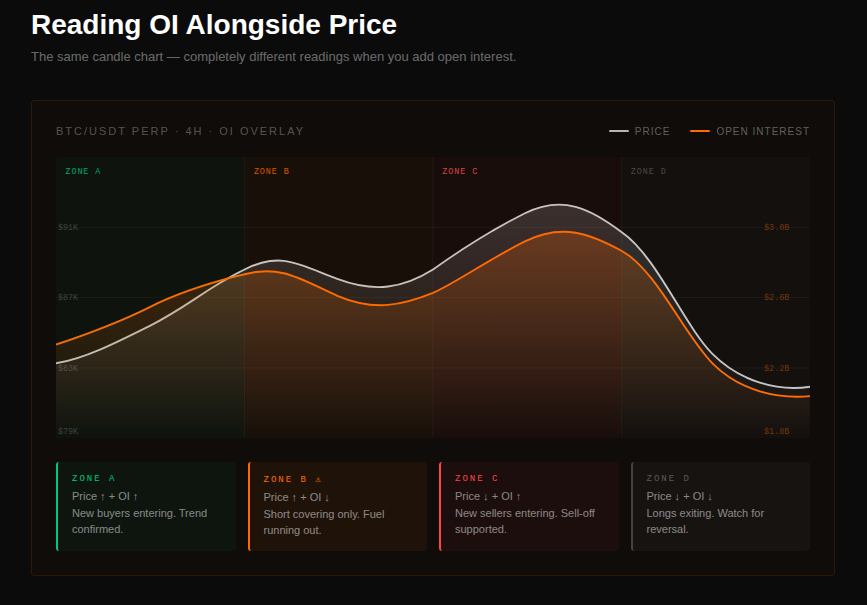
The mechanics sound technical. The application is direct.
Before entering a breakout, check whether open interest is expanding alongside the move. A breakout where both OI and volume are rising is a breakout where new participants are committing capital in real time — a higher-quality setup than one running on volume alone. BTC pushing through $90,000 while OI climbs from $2.1B to $2.4B across the session is a fundamentally different trade than BTC at $90,000 with OI sliding from $2.7B.
When a trend has been running for several days, use OI as an early warning system. A healthy trend shows OI holding steady or climbing as price extends. When OI starts dropping while price grinds higher, fuel is leaving the move — positions are being closed, not added. The trend may grind a bit further, but the structural support underneath it is weakening.
When a sharp move happens on collapsing OI, treat it with skepticism no matter how clean the chart looks. As Strike.money puts it, breakout confirmation requires rising OI — if the breakout happens with falling OI, it's likely false. The instinct to chase that candle is exactly what the setup punishes.
Open Interest Adds the Dimension Price and Volume Can't
Price and volume give a two-dimensional view of the market. Open interest adds a third: positioning. Per Strike.money, price shows direction, volume shows intensity, and open interest shows conviction — together, the three elements separate false moves from real trends.
A candle can look bullish and be driven entirely by forced buying from trapped shorts. A sharp sell-off can look catastrophic and mostly be exhausted longs exiting with no new short pressure behind it. Open interest is what separates the signal from the structural noise.
Stop asking "where is price going?" Start asking "who's behind this move, and what happens when they're done?"
FAQ
What is open interest in crypto futures?
Open interest is the total number of futures or perpetual contracts currently open and unsettled in a market, reflecting how much capital is actively committed rather than how many trades have occurred.
Is rising open interest bullish or bearish?
Neither on its own — open interest is directionally neutral. It only signals strength or weakness when read together with the direction price is moving.
Why does open interest fall while price rises?
This usually happens during a short-covering rally, where traders close losing short positions by buying back contracts, mechanically pushing price up without new buyers entering.
How is open interest different from trading volume?
Volume counts every contract traded during a period, including round trips, while open interest counts only the contracts still open at a given moment.
Does open interest predict where price will go next?
No. Open interest shows how much committed positioning exists behind a move, but the direction still depends on whether that positioning is long or short.
Why are crypto futures more prone to OI traps than traditional futures?
Crypto's liquidation cascades produce fast, sharp price spikes driven by forced position closures, which create rising-price, falling-OI setups more frequently than in less leveraged traditional markets.
Where can I track open interest changes in real time for crypto?
Most major exchanges publish open interest data, and aggregator platforms like QuantFlows display it live across multiple exchanges alongside CVD and liquidation data for direct comparison.
Track open interest changes in real time across Binance, Bybit, OKX, and Hyperliquid — alongside CVD, liquidation clusters, and live order book depth, all on one screen, free during beta at quantflows.xyz.