The bid side had three times the volume of the ask. By every textbook definition of order flow imbalance, BTC at $94,800 looked like a long. Six minutes later it was $92,400. The buy-side imbalance was visible. The buying pressure was real. What wasn't real was the $80M in limit bids that disappeared the moment price started moving toward them — pulled by whoever placed them before a single fill could execute.
Order flow imbalance is one of the most actionable signals in futures trading. It's also one of the most manipulated. Reading it correctly means understanding not just what the imbalance is, but whether the orders creating it actually intend to trade.
What Order Flow Imbalance Measures
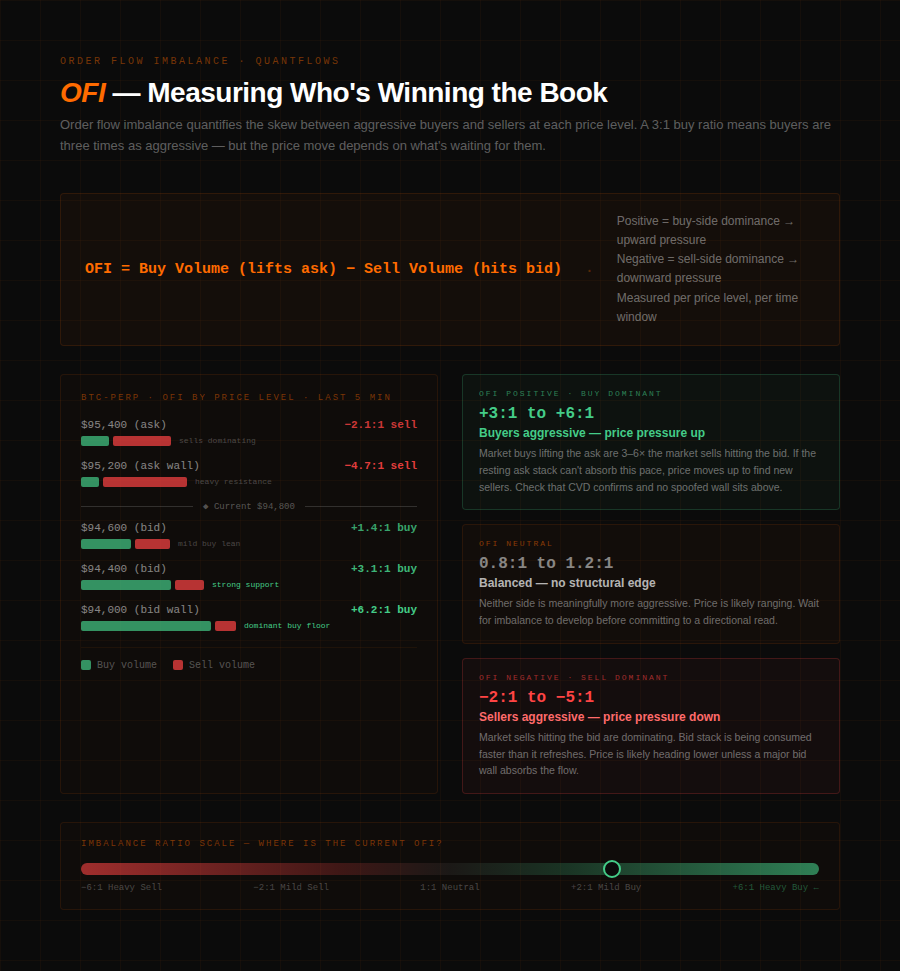
Order flow imbalance (OFI) is the difference between aggressive buying volume and aggressive selling volume at a price level. When buyers are sending more market orders that lift the ask than sellers are sending market orders to hit the bid, the imbalance is buy-skewed. When sellers dominate, it's sell-skewed. The direction and magnitude of that skew, measured in real time, is a leading indicator of short-term price direction.
The mechanics are direct. A 3:1 buy-side imbalance at $94,800 means three times as many aggressive market buy orders are hitting that level as market sell orders. Buyers want in more than sellers want out. That pressure, if sustained, drives price higher — the ask stack gets consumed faster than it refreshes, and the market moves up to find the next available sellers.
QuantFlows tracks this imbalance live across Binance, Bybit, OKX, and Hyperliquid simultaneously. The heatmap renders the resting limit order density at each price level, while executed volume data lets you see the real-time tilt of who's being aggressive. A level where bids are stacking and market buys are printing is structurally different from a level where bids are present but no one is aggressively lifting — and that difference is visible in the data before price confirms it.
The Three Things Imbalance Can Tell You
A significant order flow imbalance is not a trade signal by itself. It's context. Three things happen when imbalance builds at a level, and each has a different implication.
First: price moves with the imbalance. Buy-side pressure overwhelms the resting ask stack, sellers get filled and don't refresh fast enough, and price lifts. This is the textbook outcome — aggressive demand exceeds passive supply at the current price, so the market reprices higher to locate new sellers. CVD rising alongside this imbalance in QuantFlows confirms the read: both the aggressive order flow and the delta are aligned.
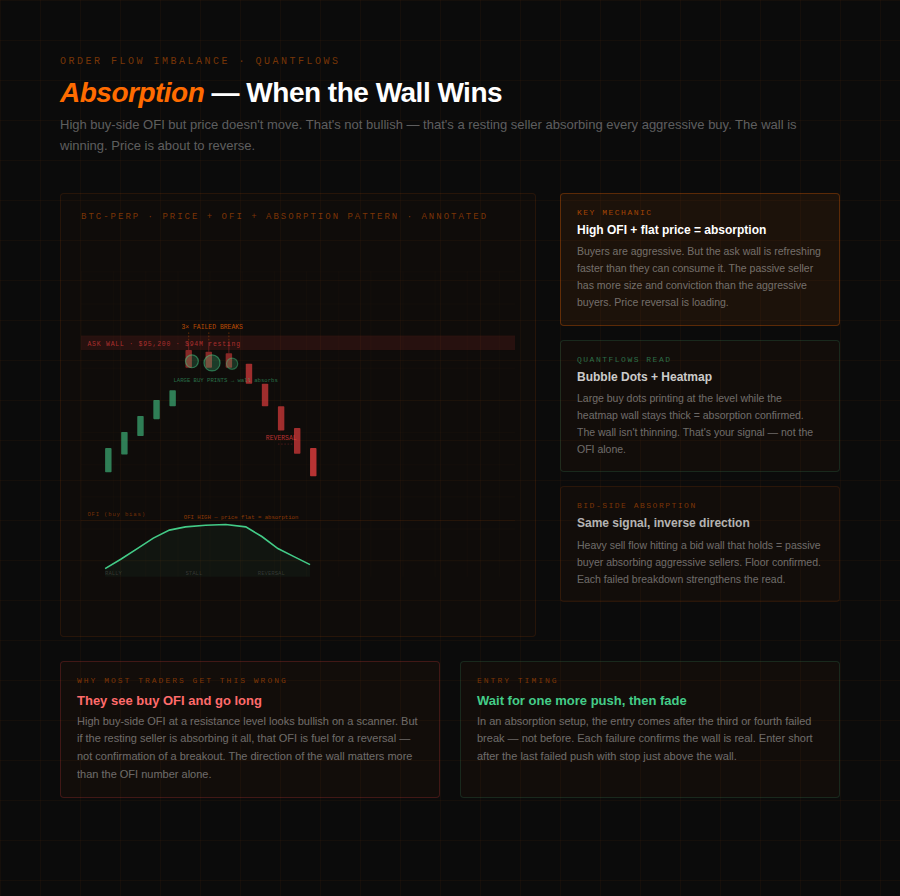
Second: price stalls despite the imbalance. This is absorption. A large resting limit sell wall at $95,200 sits in the book with $90M+ of orders. Buyers are aggressive — market buys are lifting the ask repeatedly — but price won't close above $95,200. Every aggressive buy order is being absorbed by the passive seller refreshing their position. When you see high buy-side OFI but flat price action at a wall, the wall is winning the tug of war. That's a bearish signal, not a bullish one — the resting seller has more conviction and more size than the buyers attacking them.
Third: the imbalance disappears before price arrives. That's spoofing, and it's the scenario that dropped BTC $2,400 in the opening example.
Absorption: When the Wall Wins
Absorption is the counter-intuitive read that trips most traders. The order book looks bullish — buy-side imbalance, CVD rising, price pushing up into a level. Then price stops. And stops again. And stops a third time at exactly the same level.
What's happening is visible in the heatmap. The ask wall at that level isn't shrinking. Every time aggressive market buys hit it, the resting seller refills. The passive order isn't there to make a quick profit and step aside — it's there to cap the price. Whoever placed it has the size and the intent to absorb everything the buy side brings.
QuantFlows shows this through the interaction between the heatmap and Bubble Market Dots. If large buy-side dots are printing at a level and the heatmap wall isn't thinning, you're watching absorption in real time. The level isn't about to break — it's about to reverse price. The correct read is bearish, because the seller with size is demonstrably winning.
The inverse happens on the bid side. A support level with a thick bid wall holds repeatedly against sell pressure — price dips into it, large sell orders fire, price bounces. Each failed breakdown confirms the passive buyer is absorbing the aggression. CVD stabilizing or ticking up during those tests, visible live in QuantFlows, is the confirmation that the floor is real.
Spoofing: The Imbalance That Isn't There
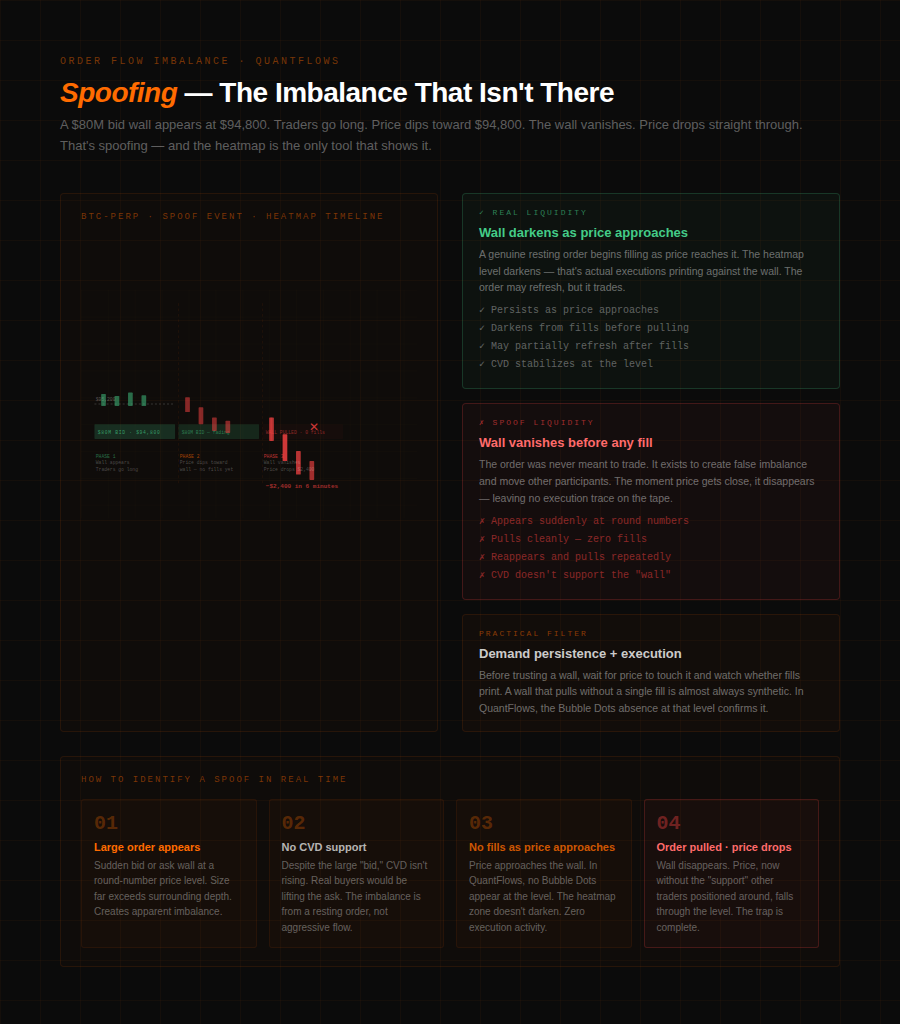
Spoofing is placing large orders with no intent to fill them. A trader — or an algorithm — drops $80M of limit bids into the book at $94,800, creating the appearance of enormous buy-side support. Other participants see the wall, interpret it as bullish, and buy. Price dips toward $94,800. The spoofer pulls the $80M before it executes, and price — now with no actual support beneath it — drops straight through the level.
The CFTC prohibits spoofing in regulated futures markets. In crypto, enforcement is inconsistent, which means self-detection is essential. The pattern is recognizable: large orders appear rapidly, persist briefly, and disappear just before price reaches them. They never fill. The heatmap in QuantFlows makes this behaviorally visible — a genuine resting order darkens as price approaches and begins printing fills. A spoofed order pulls cleanly, leaving no execution trace.
The practical filter is persistence. A wall that holds as price approaches and slowly darkens from fills is a real liquidity level. A wall that appears during consolidation and evaporates the moment price moves toward it is a signal to do the opposite of what it implies.
Reading All Three in QuantFlows
The full OFI read in QuantFlows combines three layers: the heatmap showing resting order density, CVD showing the running tilt of aggressive order flow, and Bubble Market Dots showing where large individual transactions are executing.
A clean buy-side imbalance setup looks like this: bid density building below current price on the heatmap, CVD trending up as market buys lift the ask, and Bubble Market Dots showing large buy prints executing at the level. The wall isn't thinning faster than it's refreshing — it's holding and absorbing attempts to sell through it. That's a structurally supported level, and the imbalance is confirmed across multiple data layers.
A false buy-side imbalance looks like this: a large bid wall appearing suddenly, CVD flat or drifting down despite the apparent bid support, no large buy prints executing in the tape. When price finally approaches the wall and it disappears before trading against it, that's the exit signal — or the short entry.
Absorption setups work in reverse: aggressive buy flow printing against a sell wall, CVD rising but price pinned, Bubble Market Dots showing repeated buy-side orders at the same level failing to push through. That's a level where the heatmap is showing you the ceiling before the candle closes below it.
None of these reads require predicting where price goes. They require understanding who has size, who's actively transacting, and which orders are real. The imbalance tells you where the fight is. The heatmap, CVD, and tape tell you who's winning it.
QuantFlows surfaces all of this live across Binance, Bybit, OKX, and Hyperliquid in one panel — heatmap, CVD, liquidation clusters, and Bubble Market Dots. Free during beta at quantflows.xyz.