Key Takeaway
- Bright bands show where orders are concentrated — not whether those orders will hold when price arrives. Behavioral confirmation is always required.
- Ghost walls are fake orders pulled before price arrives — they look identical to real orders but leave zero execution evidence, no CVD response, and no Bubble Dots.
- Reading one exchange's heatmap is reading 20–25% of the BTC futures market. Cross-exchange confirmation across Binance, Bybit, OKX, and Hyperliquid elevates signal quality.
- The heatmap shows passive orders only. CVD shows what aggressive flow is doing against them. Bubble Dots show the absorption anomaly. All three are required.
- Stale heatmap levels and overfitting to past patterns are responsible for a significant number of avoidable losing trades.
The order sat at $83,200 for nine minutes. Dense orange band. Obvious support. Three traders bought the level. Then the order was pulled — not filled, pulled — and price dropped $600 in four candles. The support was never there.
Heatmaps are the closest thing order flow trading has to x-ray vision. But misread or showing only part of the picture, they give false confidence, not edge. QuantFlows is a real-time order flow analytics platform that aggregates heatmap, CVD, and liquidation data across Binance, Bybit, OKX, and Hyperliquid simultaneously. These are the six mistakes traders make with that data.
Mistake 1: Treating Every Bright Band as Support or Resistance
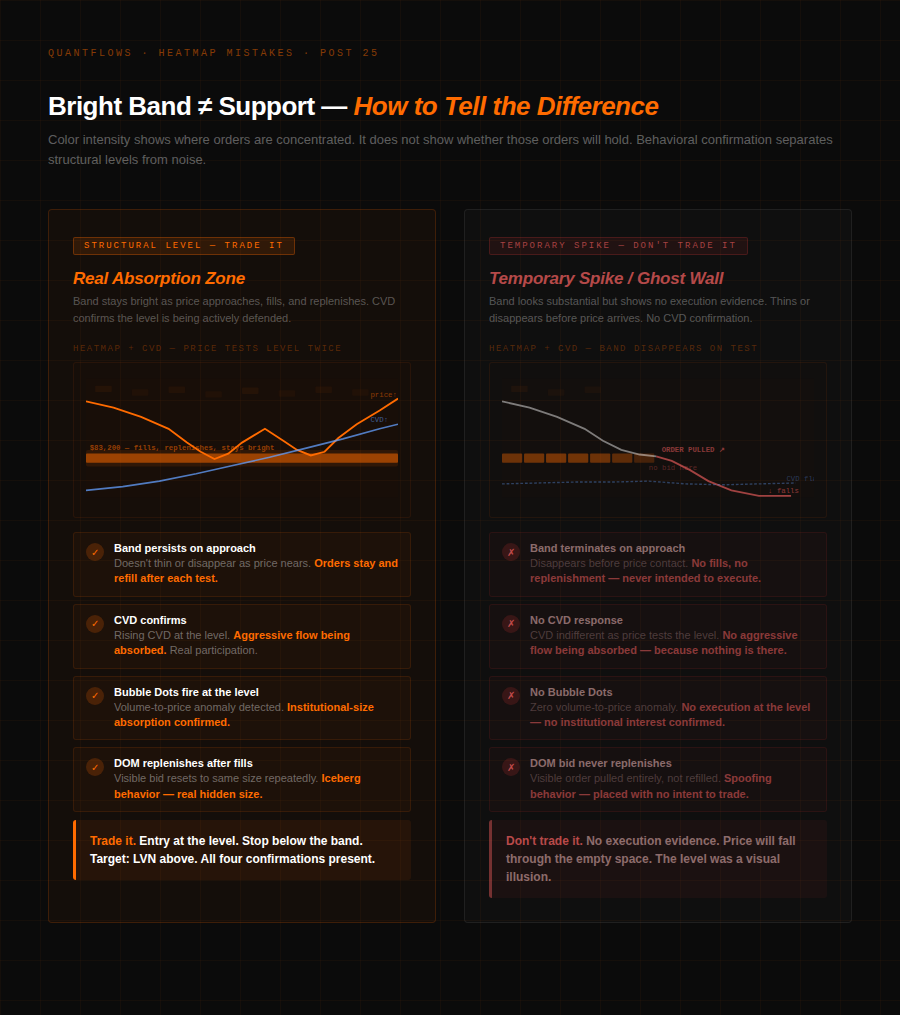
Bright bands indicate concentration of resting limit orders — not commitment to hold. As atas.net's heatmap trading guide notes, many large zones on the map become invalid over time — they get pulled or repositioned before price reaches them. Brightness indicates liquidity concentration, but not that it will stay there.
A dense zone at $83,200 means a lot of contracts are sitting there right now. It says nothing about whether those contracts will stay when price arrives, whether they belong to a committed institutional buyer or a market maker repricing in milliseconds, or whether the level reflects genuine structural interest or a temporary spike.
The fix is behavioral confirmation. Watch what happens when price approaches the band. Does CVD flatten or turn positive as the level is tested? Do orders fill and replenish — the signature of a real iceberg — or does the band start thinning? Bright bands that absorb real aggressive flow, confirmed by CVD, earn the label of support. Bright bands that simply sit there are hypotheses.
Mistake 2: Confusing Ghost Walls for Genuine Liquidity
Ghost walls are the most dangerous heatmap misread. A large order appears, sits visibly for several minutes creating an impression of a major level, then vanishes the moment price gets within range. The order was never executed. It was placed with no intent to trade.
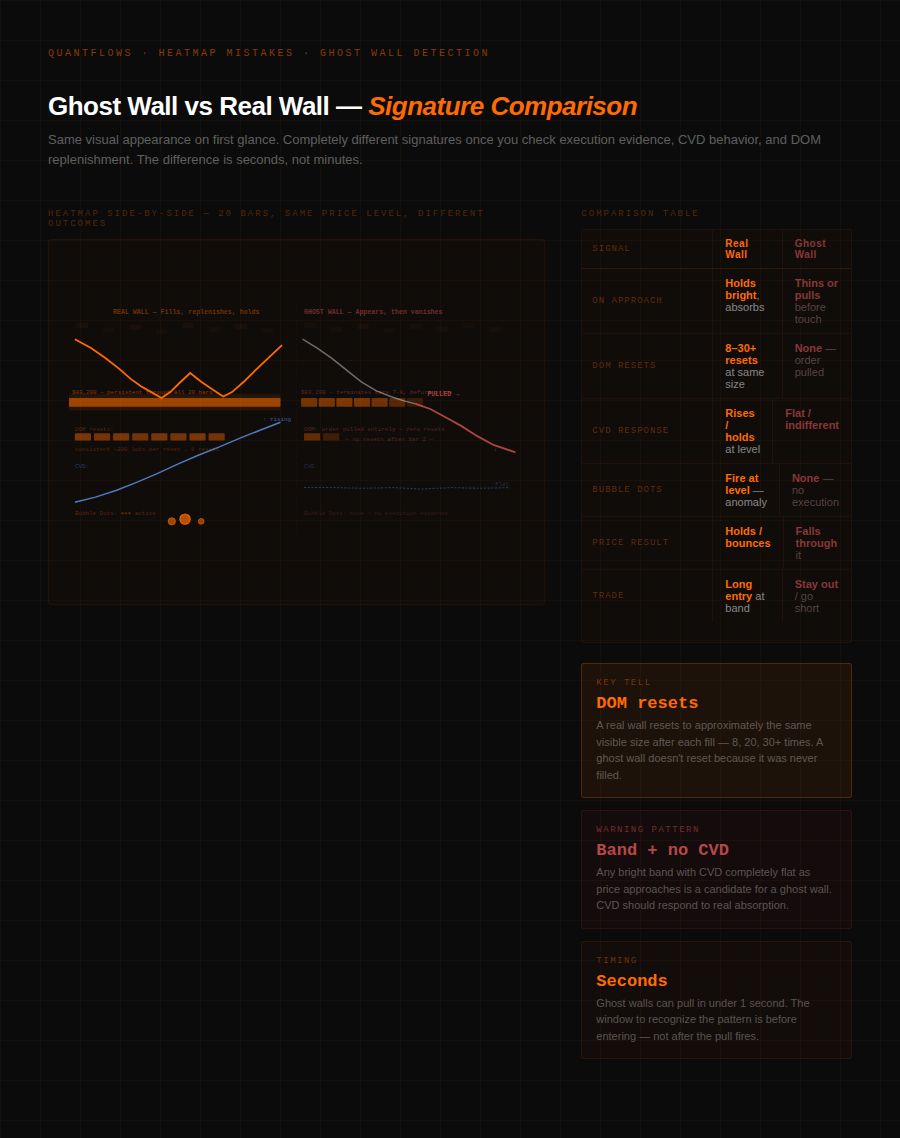
As AlgoStorm's order book heatmap guide confirms, treating every bright band as support or resistance without behavior confirmation is one of the four most common heatmap mistakes professionals identify. The behavioral signature of a ghost wall is unmistakable: a bright band that traces horizontally for multiple bars then terminates abruptly before price contact — no CVD response, no Bubble Dots, no execution evidence.
The fix: require execution evidence before trusting any level. Bubble Market Dots firing, CVD responding to the test, DOM showing replenishment patterns. A band with no execution evidence is a ghost wall candidate until proven otherwise. For the full ghost wall vs iceberg comparison, see the iceberg orders guide.
What Does the Heatmap Actually Show — and What Doesn't It?
The heatmap shows resting limit orders. It does not show market orders executing, stop-loss triggers, or the intent behind any order. Traders who treat the heatmap as a complete picture end up with a systematically incomplete read.
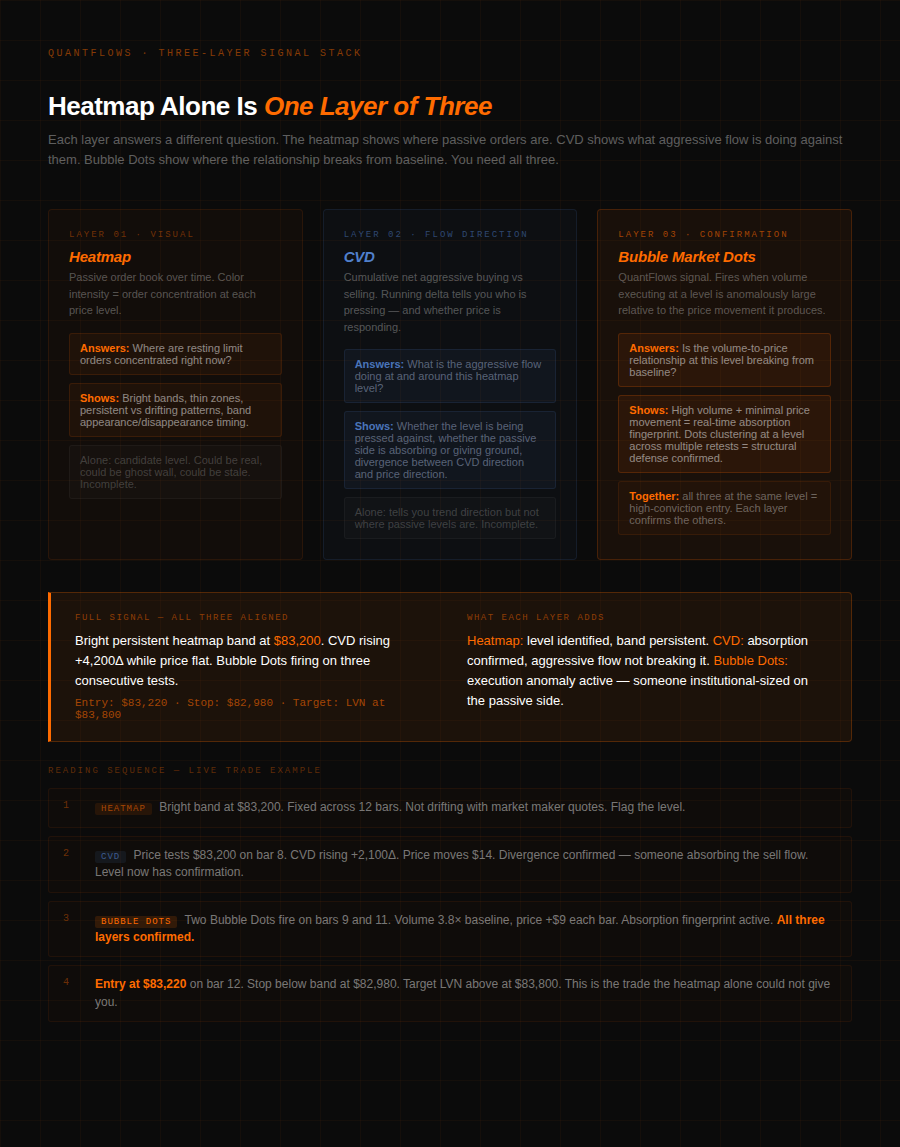
The most common version: treating a large visible offer as certain resistance and shorting into it without checking whether CVD is rising against that offer. A rising CVD at a thick offer means aggressive buyers are pressing and the offer is absorbing. When it exhausts, price doesn't reject — it rips through. The fix is using the heatmap as one layer of a three-layer read: heatmap shows where passive orders are, CVD shows what aggressive flow is doing against them, Bubble Market Dots show where the volume-to-price ratio breaks from baseline. For the full three-layer framework, see the order flow analysis guide.
Mistake 3: Reading a Single Exchange as the Full Picture
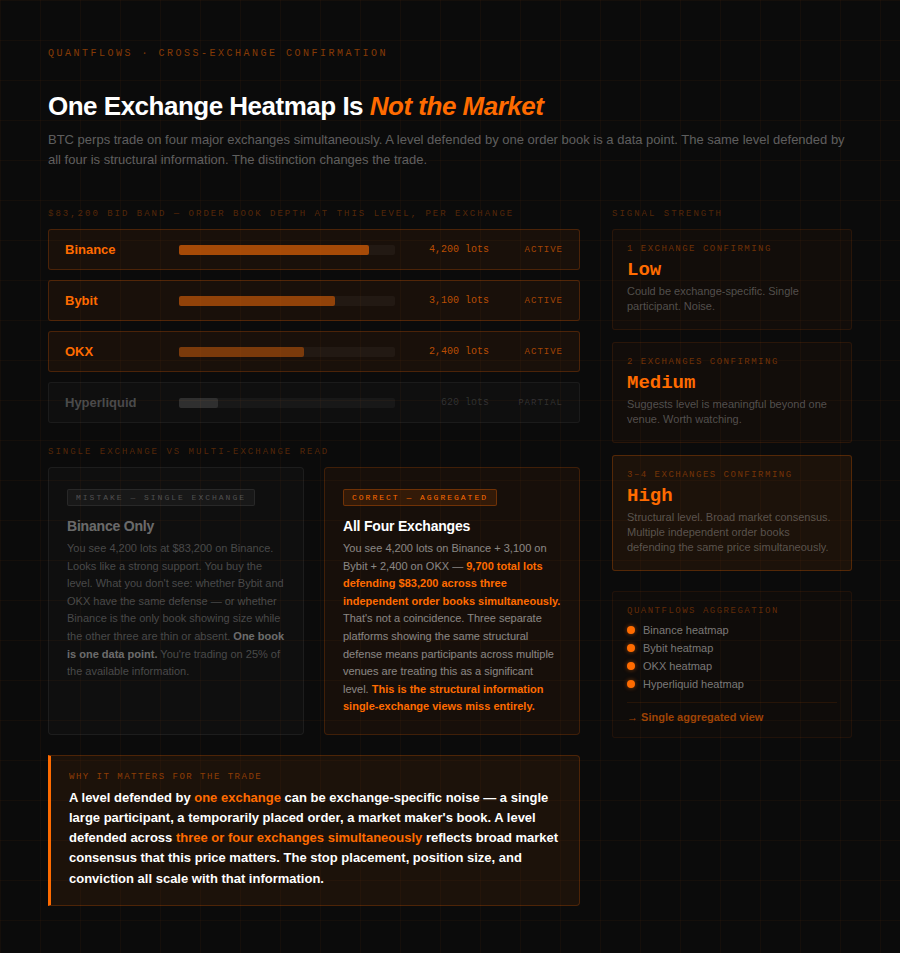
BTC perpetual futures trade simultaneously across Binance, Bybit, OKX, Hyperliquid, and others — with meaningfully different order book depths on each. A trader watching only the Binance heatmap is seeing one of four or five simultaneous order books and treating it as the complete market.
A level showing a bright band on Binance becomes genuinely significant when the same level shows persistence on Bybit and OKX simultaneously. Three independent order books defending the same price is structural information. One exchange defending it while the others are neutral is not. QuantFlows aggregates heatmap data across all four exchanges into a single view — a bright band appearing on all four simultaneously is a structurally different signal from a band on one.
Mistake 4: Treating Stale Heatmap Data as Current Reality
Heatmap bands represent the order book at the time the data was captured. Order books change. A thick bid at $83,200 that formed two hours ago may have been partially absorbed, moved by its owner, or replaced by different participants at a slightly different level.
This is particularly acute around macro events. A high liquidity zone identified before a Fed announcement has no guaranteed relevance after it. The participants who built that level may have exited entirely.
The fix: treat heatmap levels as hypotheses requiring live confirmation, not prior conclusions that just need price to arrive. When price approaches a level identified earlier, check whether the band is still intact and CVD is still confirming. If the bright zone has thinned or CVD isn't responding — the level has degraded. Don't trade the memory of it.
Mistake 5: Overfitting to Past Patterns
The heatmap makes patterns vivid. A bright band held three times. Traders build rules around these vivid patterns and trade them mechanically going forward.
The same level can behave completely differently on different days, in different volume environments, against different macro backdrops. As AlgoStorm's heatmap guide notes, trading right into top-tier news without adjusting heatmap readings is one of the most persistent professional mistakes — the very levels that held all week become irrelevant the moment a catalyst hits.
The fix: trade the live signal on each new test. Evaluate current CVD, current DOM state, and what Bubble Dots are firing right now. The historical context is useful background. It is not the entry reason.
What Correct Heatmap Use Looks Like
Each mistake above shares a common root: treating the heatmap as a conclusion rather than evidence. The heatmap is the best available visualization of where passive liquidity sits — but it becomes edge only when combined with CVD to confirm what aggressive flow is doing against that liquidity, and Bubble Market Dots to identify where the volume-to-price relationship breaks from baseline.
On QuantFlows, these three layers live in the same view across four exchanges. The heatmap surfaces the candidate level. CVD confirms or denies the absorption signal. Bubble Dots mark where institutional-sized flow is meeting passive defense. Anything less leaves money on the table.
Frequently Asked Questions
- Why do bright heatmap bands not always act as support? Bright bands show order concentration, not commitment to hold. Those orders can be from market makers repricing instantly or spoofers who will pull them before execution. CVD response, DOM replenishment, and Bubble Market Dots are required to confirm a band is a real structural level.
- What is a ghost wall in trading? A ghost wall is a large visible DOM order placed with no intent to execute, pulled before price arrives. On the heatmap it appears as a bright band terminating before price contact with no CVD response or Bubble Market Dots — unlike a real iceberg which fills, replenishes, and leaves execution evidence.
- Why should you use multiple exchanges when reading heatmaps? BTC perpetual futures trade on Binance, Bybit, OKX, and Hyperliquid simultaneously. A level appearing on all four simultaneously is structurally significant — single-exchange heatmap reading covers roughly 20–25% of total market depth.
- What are the three signals that confirm a heatmap level is genuine? CVD moving in the direction of the level on each test, DOM replenishment after each fill (same visible size reappearing), and Bubble Market Dots firing at the level. All three together is high conviction. Any one alone is insufficient.
- How does stale heatmap data cause losing trades? Order books change continuously. A thick bid at session open may be absorbed or repositioned by afternoon. Before entering any heatmap-based trade, confirm the band is still intact, still absorbing on tests, and still showing CVD confirmation.
QuantFlows surfaces heatmap depth, CVD, and Bubble Market Dots across Binance, Bybit, OKX, and Hyperliquid in one view. Free during beta at quantflows.xyz.