Key Takeaways
- Market structure is the framework price creates through a sequence of swing highs and lows — bullish (HH/HL), bearish (LH/LL), or sideways (EH/EL).
- A Break of Structure (BOS) signals trend continuation. A Change of Character (CHOCH) signals a potential reversal — but requires order flow confirmation before acting.
- A false CHOCH is a stop run disguised as a reversal — CVD rising through the breakdown is the tell that absorption is occurring, not a genuine structural shift.
- Higher timeframe structure defines directional bias. Lower timeframe structure defines the entry trigger — a CHOCH in the direction of the dominant trend.
- Structure without order flow is a hypothesis. Confirmed by CVD, heatmap, and Bubble Dots across four exchanges it becomes a trade with edge.
At 14:32, BTC printed its fourth consecutive higher high. Sixteen minutes later, price closed below the prior swing low. Most traders were still long. The structure break wasn't random — CVD had been declining for eight bars before the close, and the new high was a liquidity raid, not a continuation.
Market structure is the framework every trade setup exists inside. QuantFlows is a real-time order flow analytics platform that aggregates heatmap, CVD, and liquidation data across Binance, Bybit, OKX, and Hyperliquid simultaneously — and market structure defines where those order flow signals matter most.
What Is Market Structure in Trading?
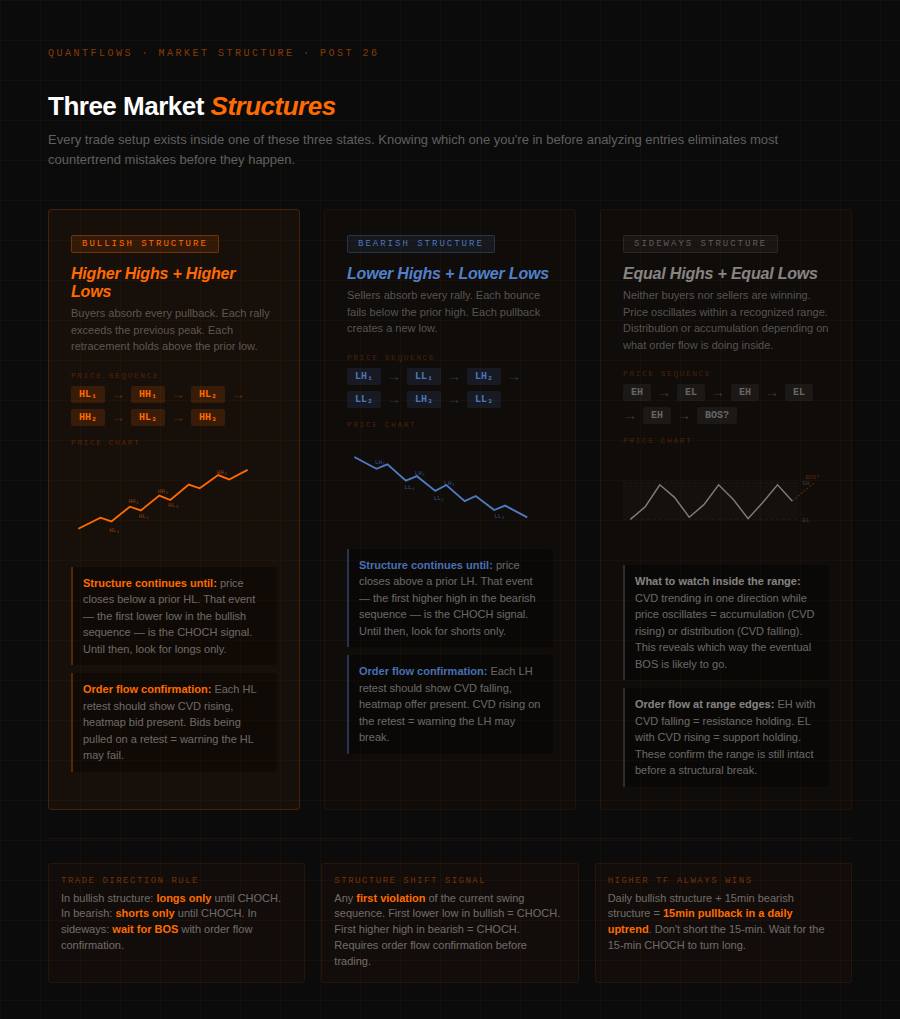
Market structure is the framework price creates over time through a sequence of swing highs and swing lows — bullish, bearish, or sideways — based purely on what price has done.
- A bullish market structure is a sequence of higher highs (HH) and higher lows (HL). Price makes a new high, pulls back but holds above the prior swing low, then pushes to another new high. Buyers are in control — each pullback gets bought.
- A bearish market structure is the inverse: lower highs (LH) and lower lows (LL). Each rally fails below the prior swing high. Each pullback creates a new low. Sellers absorb every attempt to recover.
- A sideways structure — equal highs and equal lows — means neither side has control. As Ultima Markets explains in their BOS trading guide, BOS cannot be studied in isolation — it is a tool for reading market structure in real time, helping traders distinguish between simple noise and meaningful shifts in supply and demand. CVD inside a sideways range reveals which side is accumulating before the eventual breakout.
What Is BOS and CHOCH in Trading?
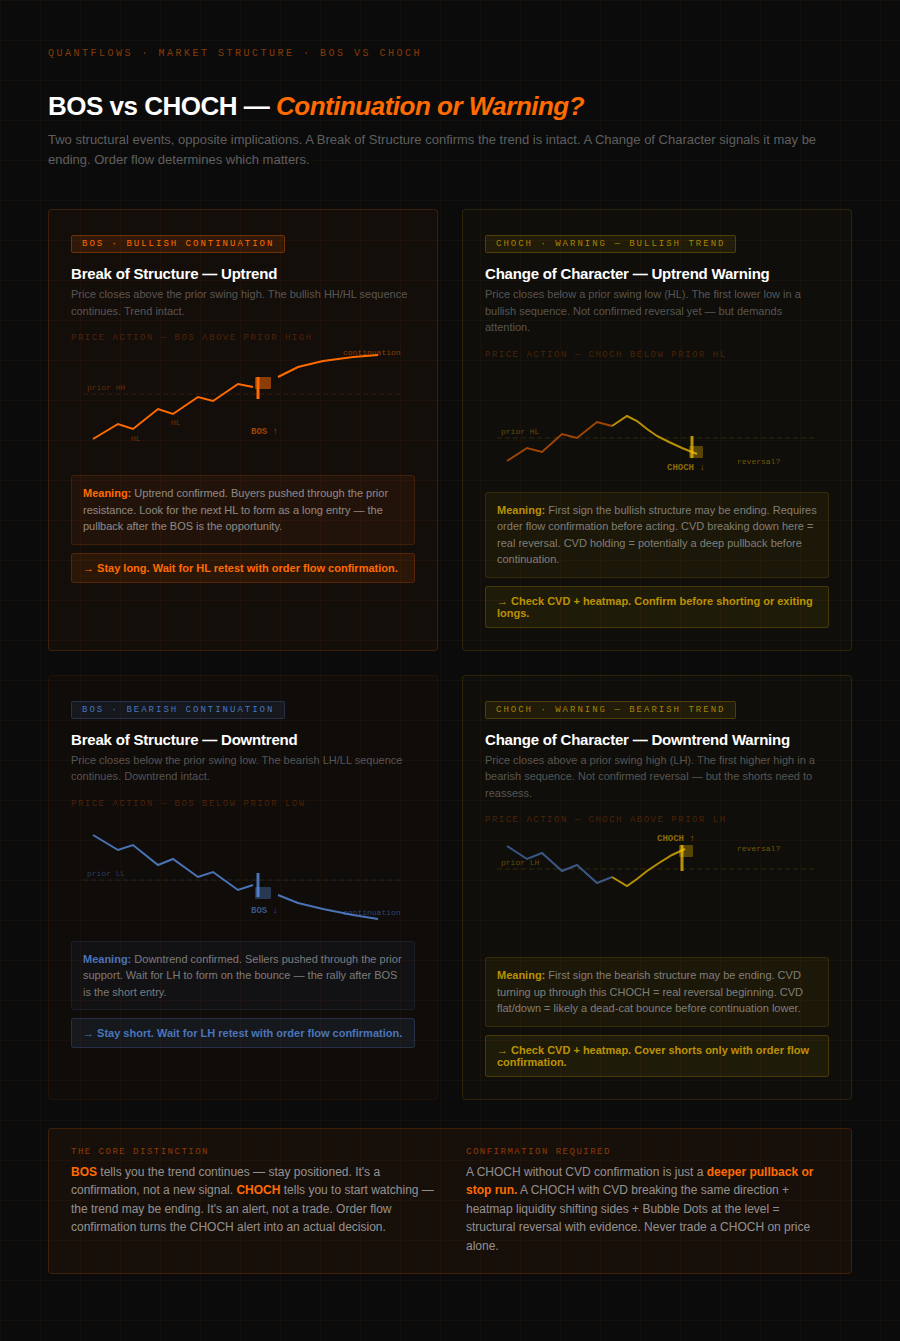
A Break of Structure (BOS) is a continuation signal — price breaks and closes beyond the prior swing high in an uptrend, or below the prior swing low in a downtrend, confirming the trend is still intact.
A Change of Character (CHOCH) is the early warning of a potential reversal — price sweeping the prior swing low in a bullish structure is a CHOCH. As FXOpen's break of structure guide explains, while a BOS aligns with the trend's direction, a CHOCH represents a break in the opposite direction — it happens when a previously strong swing point is breached, potentially suggesting the onset of a new trend.
The difference matters enormously in practice. A CHOCH without order flow confirmation is just a deeper pullback that gets bought. A CHOCH accompanied by CVD breaking in the same direction, heatmap bid walls being pulled, and Bubble Dots absent — that's a real structural reversal. For how CHOCH interacts with stop run mechanics, see the stop run detection guide.
Why Structure Breaks Fail Without Order Flow Confirmation
The central limitation of market structure analysis alone: it tells you what happened, not why.
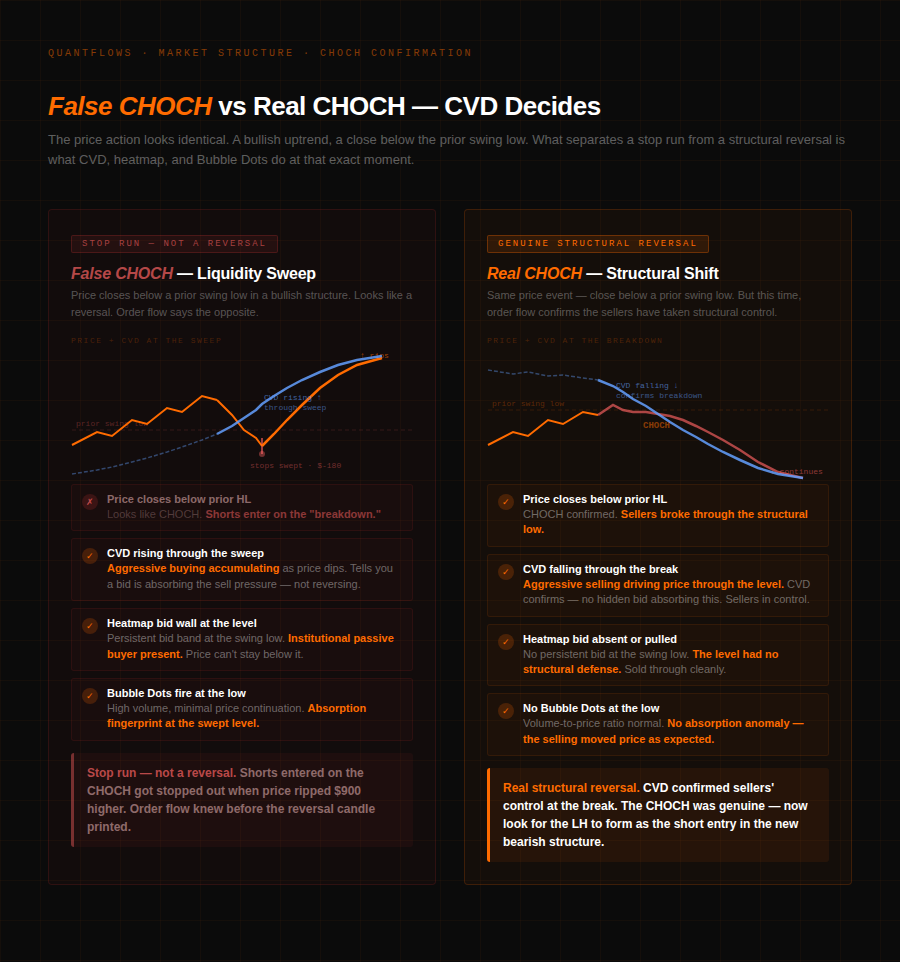
BTC produces false CHOCHs constantly. Price breaks below a prior swing low — traders read bearish CHOCH and short the break. Price reverses immediately back above the broken level and continues higher. The CHOCH was a stop run, not a reversal. CVD rose through the sweep — aggressive buying accumulating as price dipped. The heatmap showed a persistent bid wall. Bubble Market Dots fired at the low. Every order flow signal said absorption. Structure said CHOCH. Order flow was right.
This is the core of using market structure intelligently: structure defines the framework. Order flow tells you whether the framework is shifting for real or being temporarily violated to harvest liquidity. For how this plays out specifically in stop runs, see the order flow analysis guide.
How to Use Market Structure Across Timeframes
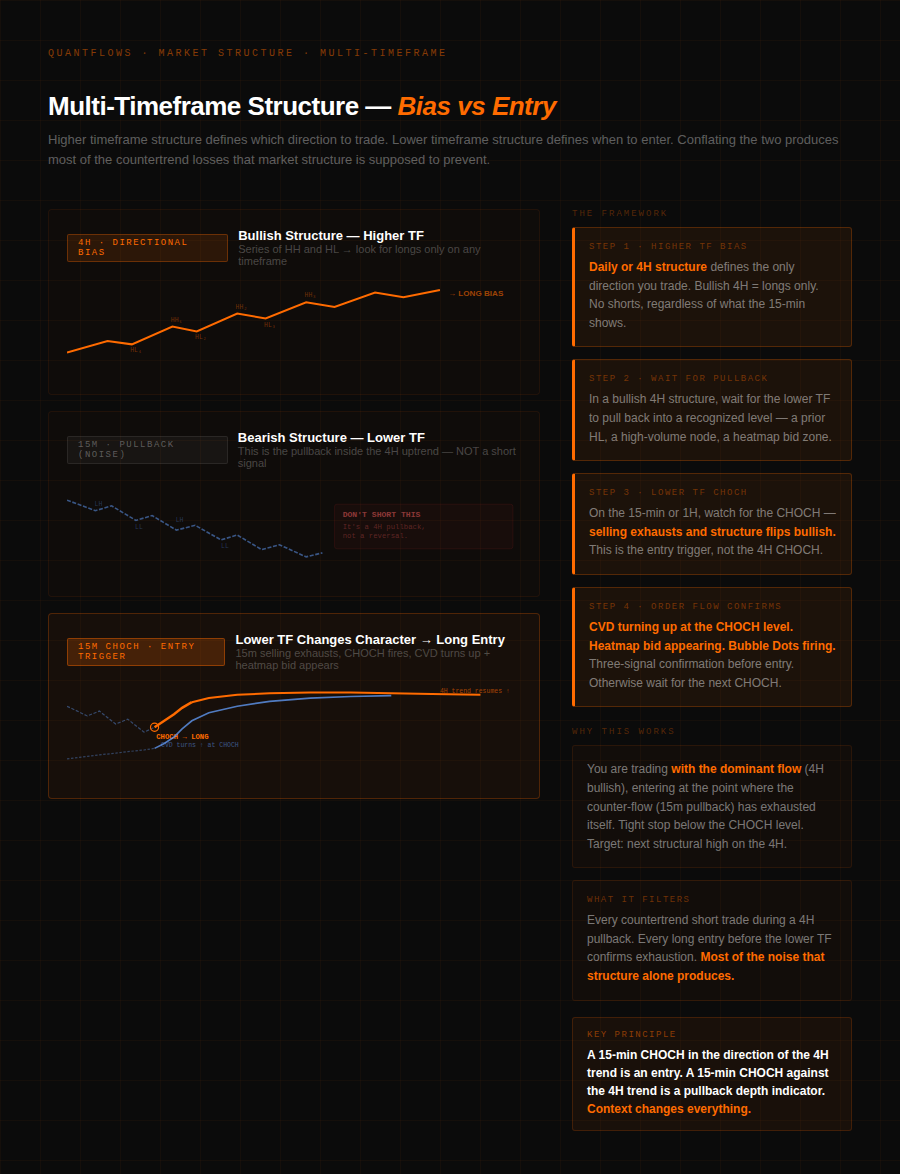
Higher timeframe structure defines the directional bias. Lower timeframe structure defines the entry trigger.
As XS.com notes in their BOS trading guide, using higher timeframes (H4–Daily) for direction bias and lower timeframes (M5–M30) for entries is a standard multi-timeframe approach. In a bullish 4H structure, a 15-minute CHOCH after a pullback — the moment short-term selling exhausts and the dominant direction reasserts — is the entry, not a reversal signal.
Higher timeframe structure also filters noise. A CHOCH on a 1-minute chart in the context of a bullish 4-hour structure means almost nothing. The same CHOCH on a 4-hour chart in the context of a bearish daily structure is material.
How Structure and Order Flow Work Together
Traditional support and resistance — horizontal lines at prior highs and lows — works because those levels mark where market structure previously turned. Market structure gives those levels meaning. Order flow adds the live layer.
A prior swing high at $83,200 being retested: does the heatmap show a persistent offer at that level, or is it thin? Is CVD declining as price approaches — sellers absorbing — or is CVD rising, suggesting buyers are pressing and the level may break? The structural level tells you where to look. Order flow tells you what to do when price gets there.
On QuantFlows, that combination — structure + live CVD + heatmap + Bubble Dots — runs across Binance, Bybit, OKX, and Hyperliquid simultaneously. The structure identifies the zone. The order flow confirms whether to trade it.
Frequently Asked Questions
- What is market structure in trading? Market structure is the framework price creates through swing highs and lows — bullish (HH/HL), bearish (LH/LL), or sideways (EH/EL). Every trade setup exists inside one of these three states. Knowing which one prevents most countertrend mistakes before they happen.
- What is the difference between BOS and CHOCH? A Break of Structure (BOS) confirms trend continuation — price breaks in the direction of the existing trend. A Change of Character (CHOCH) warns of potential reversal — price breaks against the existing trend sequence. BOS means stay positioned. CHOCH means check order flow before acting.
- What is a false CHOCH in trading? A false CHOCH is a stop run disguised as a structural reversal. Price breaks a swing level but CVD is rising through the break — indicating absorption, not genuine breakdown. Price reverses back above the broken level. Traders who acted on the price signal alone get trapped.
- How do you use market structure across multiple timeframes? Higher timeframe structure (4H or daily) defines directional bias — long or short only. Lower timeframe structure (15-min or 1-hour) defines the entry trigger — a CHOCH in the direction of the dominant trend after a pullback, confirmed by CVD turning and a heatmap bid appearing.
- Why does market structure need order flow confirmation? Market structure shows what happened — not why. A CHOCH can be a genuine reversal or a stop run. CVD breaking in the same direction as the CHOCH confirms a real reversal. CVD rising through the break confirms absorption and likely continuation. Without order flow, a CHOCH is a hypothesis.
QuantFlows visualizes multi-exchange heatmap depth, CVD, and Bubble Market Dots in real time. Free during beta at quantflows.xyz.