In early May 2025, BTC pushed into $97,000–$98,000 on heavy volume. Candles were large and green. By every traditional measure the move looked like conviction — high volume on an up-close, momentum building toward six figures. CVD told a different story. Buy-side aggression wasn't confirming the push. Volume was high but the delta was fading as price pressed higher, a textbook negative divergence. Three sessions later BTC had corrected back to $91,000. The volume said "strong move." The order flow said "nobody's driving it." Order flow was right.
This is the exact gap between volume and order flow — and it shows up in crypto futures constantly. Volume is the most widely watched indicator in markets. It's also systematically incomplete in ways most traders never account for.
What Volume Actually Tells You
Volume is the total number of contracts or units that traded hands over a given period. A 1-hour candle with 85,000 BTC contracts traded means 85,000 contracts changed ownership in that window. That's a fact. What volume doesn't tell you is which side initiated those trades.
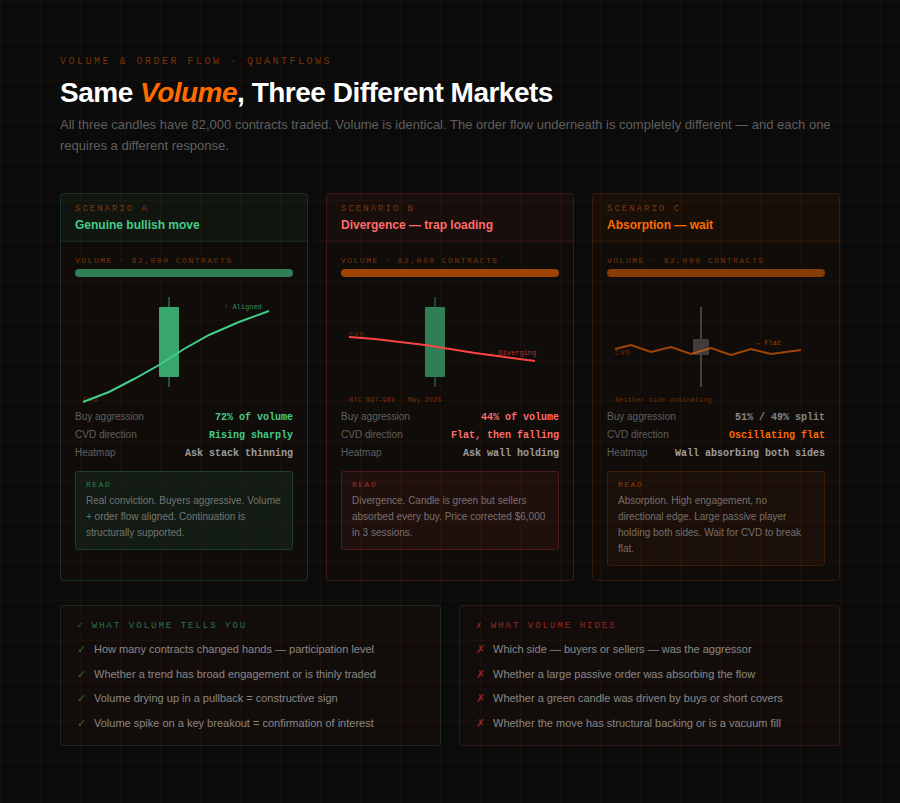
Every transaction requires a buyer and a seller. When 85,000 contracts trade, exactly 85,000 were bought and exactly 85,000 were sold — by definition. Volume alone can't tell you whether the buys were aggressive (market orders lifting the ask) or passive (resting limit orders getting hit). It can't distinguish a session dominated by one institution TWAP-accumulating quietly from a session driven by a panicked retail crowd chasing a breakout. A large green candle with massive volume and a large red candle with the same volume are identical in terms of raw volume data. The difference lives in the order flow underneath.
What volume does well: it tells you participation level. High volume during a trend confirms that many participants are engaged with the move — the market isn't ignoring what's happening. Low volume during a trend warns that few participants are engaged, which typically means the move lacks durability. Volume spikes on key breakouts or breakdowns are worth paying attention to. Volume that dries up during a pullback in an uptrend is constructive. These are useful reads.
The failure mode is confirmation bias: traders see high volume on an up candle and conclude "strong buying." The volume was high. The buying may or may not have been aggressive. Without order flow data you don't know.
What Order Flow Adds That Volume Can't
Order flow answers the question volume leaves open: who was initiating? Specifically, CVD — Cumulative Volume Delta — separates every executed trade into buy-initiated (aggressive order lifted the ask) or sell-initiated (aggressive order hit the bid), then tracks the running net balance of that aggression over time.
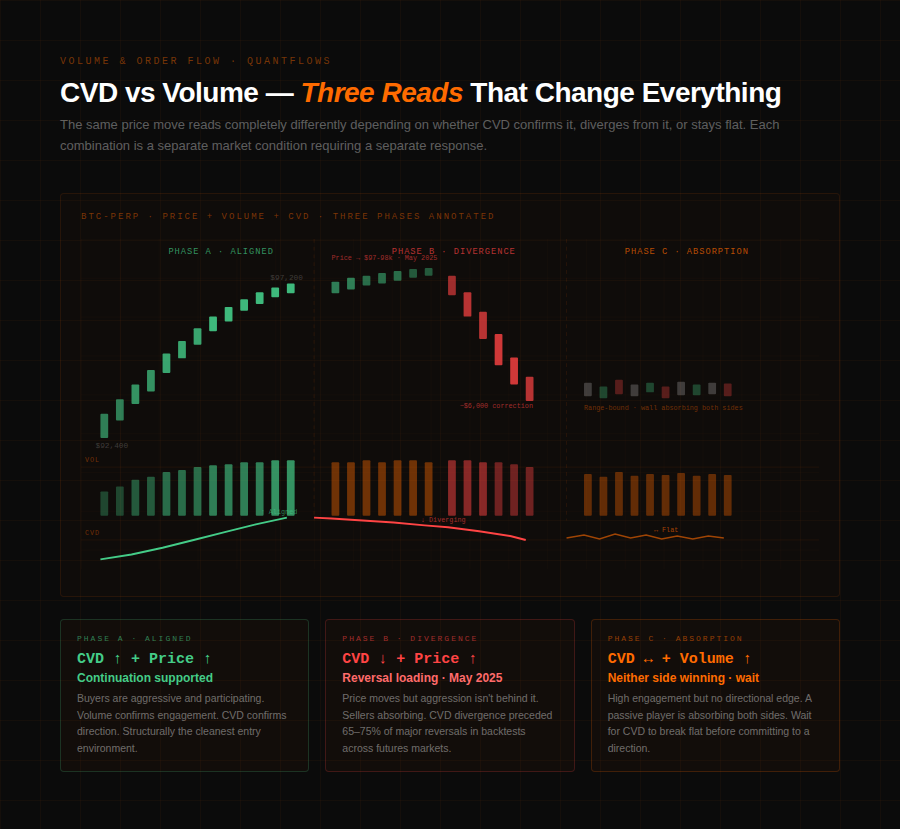
Three reads matter. First, alignment: when price rises and CVD rises together, buyers are genuinely aggressive. They're sending market orders that lift the ask, consuming passive supply. That's the strongest version of a bullish move — conviction backed by execution. The May 2025 scenario lacked this entirely. Price pressed higher but CVD was flat and then declining, meaning sellers were matching or exceeding buyers in aggression as price climbed. Someone was absorbing the push.
Second, divergence: CVD declining while price rises is not noise. It's a structural read that buyers are running out of fuel. CVD helps verify if a breakout or reversal is supported by actual order flow or if it is likely to fail — in early May 2025, Bitcoin hit a high of $97–98k while CVD failed to confirm, showing weak underlying buy pressure before the correction. Backtesting reports from major futures markets show that persistent CVD divergence often precedes a price reversal or trend exhaustion 65–75% of the time. That's not a guarantee — it's a structural signal that changes how you size and place stops.
Third, high volume with neutral CVD: this is the absorption read. High participation but neither side is clearly dominating aggression. A large passive seller is absorbing every aggressive buy without the delta tipping either way. In QuantFlows this appears as elevated volume in the heatmap zones with CVD oscillating close to flat — a wall holding while both sides fight. That's a different trade setup from a genuine trending move and it requires a different response.
Four Combinations That Actually Matter
Neither tool is complete alone. Volume without order flow can't distinguish who's aggressive. Order flow without volume context can misread low-liquidity moves — a large CVD spike on thin volume means fewer participants and lower conviction than the same spike on heavy volume. Used together they cross-validate each other and eliminate the most common false reads.
Four combinations matter in practice:
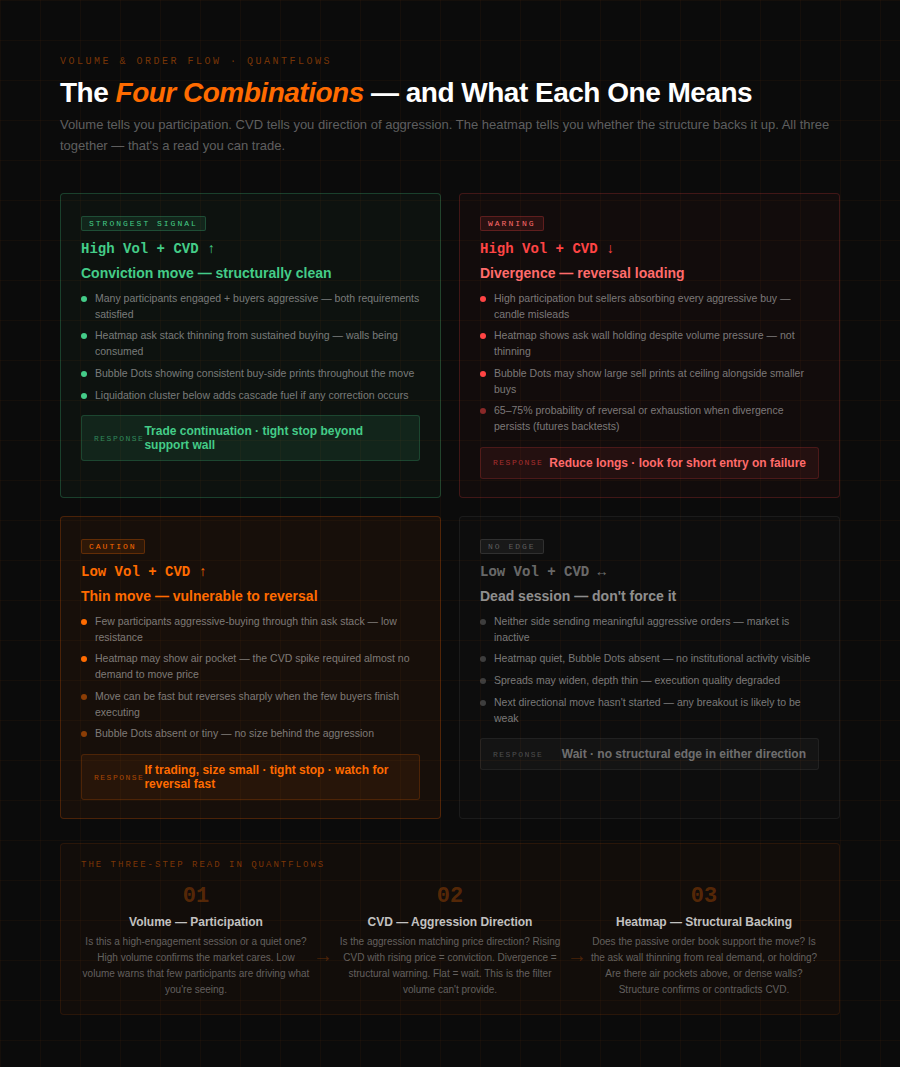
- High volume + rising CVD: The strongest confirmation of a real move. Many participants engaged, buyers aggressive. In QuantFlows this appears as the heatmap ask stack thinning from sustained buying, CVD trending up, and Bubble Market Dots showing consistent buy-side prints. This is the setup where continuation is structurally most supported.
- High volume + flat or falling CVD: The divergence setup. Large participation but the aggression isn't confirming the price move. Someone with significant size is on the other side — absorbing, distributing, or building a position against the apparent direction. This is the setup that trapped longs in the May 2025 run. In QuantFlows, the heatmap shows a wall holding while volume is elevated and CVD drifts down. Treat this as a warning, not confirmation.
- Low volume + rising CVD: A small number of aggressive buyers are moving price without broad participation. These moves can be fast and sharp but often lack staying power — they're thin and vulnerable to reversal when the few participants finish their executions. Air pocket moves often look like this.
- Low volume + flat CVD: The market is inactive. Neither side is sending meaningful aggressive orders. This is consolidation at its quietest — spreads may widen, depth may thin, and the next directional move hasn't started. QuantFlows shows this as a quiet heatmap with minimal Bubble Dots printing. Wait.
QuantFlows displays all of this simultaneously — CVD live alongside the heatmap across Binance, Bybit, OKX, and Hyperliquid, with Bubble Market Dots isolating where large individual orders are printing. The volume context is implicit in the Bubble Dots and in how quickly heatmap zones thin under pressure. The four-combination framework becomes a real-time read rather than a retrospective analysis.
Where Each Tool Lives in a Trading Workflow
Volume and order flow operate on different time horizons in a practical workflow. Volume tells you whether the session or the move has participation behind it — a higher-level filter. Order flow tells you whether that participation is aggressive and directional — a real-time read of who's winning the book right now.
A practical three-step structure: start with volume to confirm participation level — is this a high-engagement session or a quiet one? Then check CVD alignment — is the aggression matching the price direction, diverging from it, or flat? Finally check the heatmap for what the passive order book looks like under that flow — where are the walls, where are the air pockets, and does the heatmap confirm the CVD story or contradict it?
Each step narrows the field. High volume confirms engagement. CVD confirms direction of aggression. The heatmap confirms whether structural support or resistance backs the move. A trade that passes all three filters — high volume, aligned CVD, heatmap supporting the direction — is structurally clean in a way that a candle-pattern trade simply cannot match. A trade that shows high volume but CVD divergence is structurally suspect regardless of what the candle looks like.
The May 2025 BTC move to $97-98k failed all three filters. Volume was elevated — check. CVD was diverging — fail. And the heatmap showed a dense ask wall at $98,400 that held every push. Three layers of evidence that the move had no structural backing. The correction to $91,000 wasn't a surprise for anyone reading the data.
QuantFlows layers CVD, the heatmap, liquidation clusters, and Bubble Market Dots together across Binance, Bybit, OKX, and Hyperliquid in one view. Free during beta at quantflows.xyz.