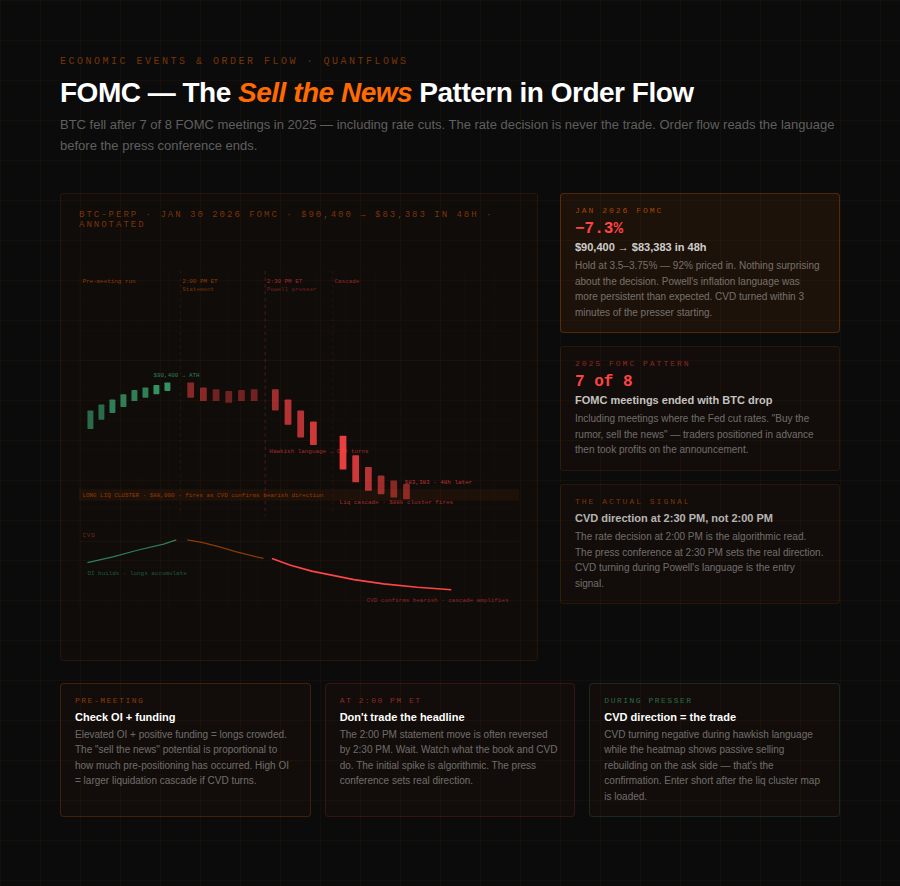
January 30, 2026. The Fed held rates at 3.5–3.75%. Markets had priced in a hold at 92% probability for weeks. Nothing about the decision itself was a surprise. Within 48 hours BTC fell from $90,400 to $83,383 — a 7.3% drop on a fully priced-in outcome. The rate decision wasn't the trade. Powell's language in the press conference was. And the order flow started reading it before the second candle closed.
This is what makes economic events different from other catalysts in crypto futures. The event itself is rarely the signal. The order flow response to the event — before it, during it, and in the sessions immediately after — is where the information lives. BTC fell after 7 of 8 FOMC meetings in 2025, including meetings where the Fed actually cut rates. The candles looked different each time. The order flow pattern was nearly identical.
Why Economic Events Hit Crypto Order Flow Differently Now
The relationship between macroeconomic data and crypto markets has structurally changed. In 2021, BTC largely ignored CPI prints. By 2025, the mechanism was explicit: when CPI numbers differ from expectations, trading algorithms execute within milliseconds. ETF investment flows shift direction automatically. Derivatives positions get closed by risk systems. The feedback loop between economic data and crypto order flow is now institutional in speed and scale.
This matters for how you use QuantFlows around events. Economic data doesn't just change the price level — it changes the texture of the order book, often for hours before the number drops. The pre-event pattern is as readable as the post-event reaction, and it's where positioning happens.
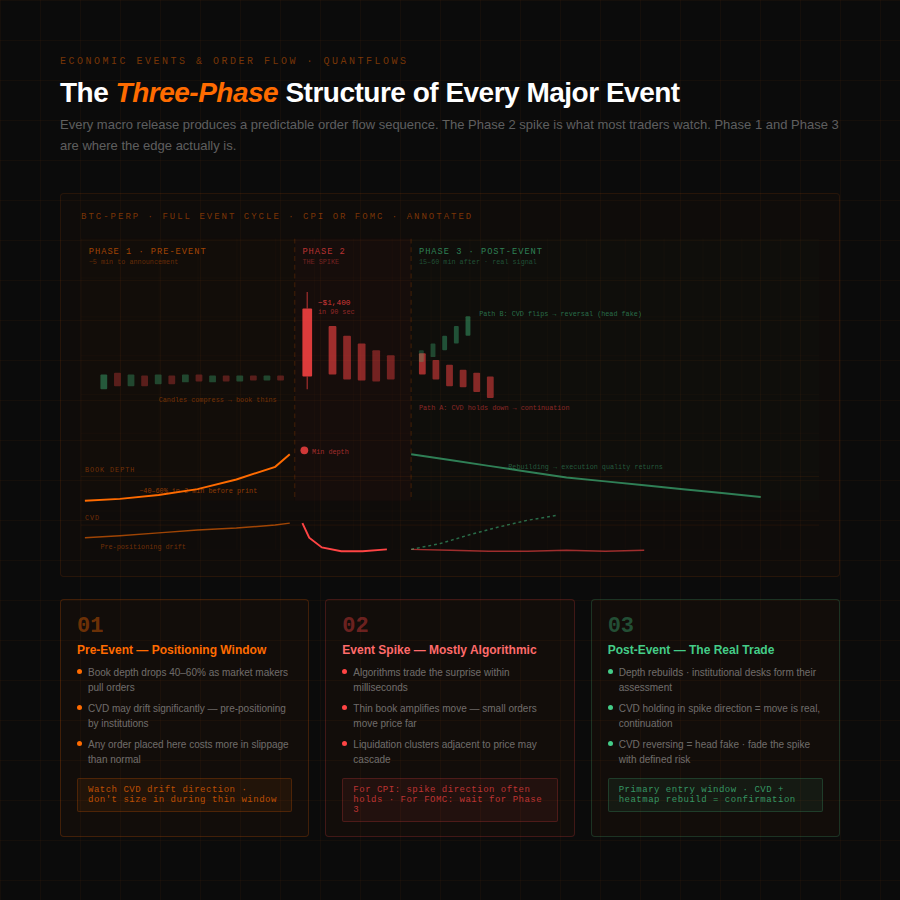
The Three Phases of an Economic Event in Order Flow
Every significant macro release produces a three-phase structure in order flow data. Understanding each phase changes how you approach the event.
Phase 1: Pre-event — depth thins, positioning builds. In the two to five minutes before a major release, market makers pull or reduce their resting limit orders. They don't want to be on the wrong side of a 50 basis point surprise. Order book depth at 0.5% from mid-price can drop 40–60% in this window. In QuantFlows, the heatmap zones lighten across all four exchanges simultaneously — Binance, Bybit, OKX, and Hyperliquid thinning in concert. Spreads widen. The book becomes fragile. Any market order placed in this window moves price further than it would five minutes earlier. Simultaneously, traders who have conviction about the outcome begin positioning. CVD starts drifting — sometimes significantly — before the print. That pre-event CVD direction is information: someone is expressing a view before the number.
Phase 2: The event — immediate spike. The data drops. Algorithms read the number, compare it to consensus, calculate the surprise magnitude, and execute within milliseconds. A CPI print 30 basis points above consensus triggers immediate sell orders in BTC futures. The book, already thin from Phase 1, can barely absorb the flow. Price moves sharply on relatively small volume because there's nothing resisting the move. CVD spikes in the direction of the surprise. Bubble Market Dots show large orders printing rapidly across multiple levels. Liquidation clusters adjacent to the current price start firing, amplifying the initial move. This is the phase most traders watch — and it's usually too late to act.
Phase 3: Post-event — the real information emerges. In the 15 to 60 minutes after the print, depth rebuilds and the "true" market read develops. This is where the distinction between a sustainable move and a head fake shows up. If CVD remains elevated in the direction of the initial spike and the heatmap rebuilds bid depth on a CPI-driven rally — buyers stepping back in as book makers return — the move has institutional backing and tends to continue. If CVD reverses and the heatmap shows passive selling into the initial spike, the move is exhausted. The initial reaction was algorithmic; the follow-through requires conviction, and conviction shows in the order flow.
FOMC: Order Flow Before Powell Speaks
FOMC meetings produce a specific order flow pattern that 2025's data made unmistakeable. BTC rallied into the announcement as traders positioned for a dovish outcome or rate cut. The announcement confirmed what was priced in — no surprise, no new information on direction. Early buyers took profits. The "sell the news" dynamic drove CVD negative within minutes of the statement. Liquidation clusters below, loaded with long positions that had accumulated during the pre-meeting run, fired sequentially as selling pressure built.
This pattern repeated across seven of eight FOMC meetings in 2025. In each case, QuantFlows showed the same sequence: OI and long positioning building in the days before the meeting, funding rates elevating (longs paying shorts, confirming skew), the book thinning sharply in the minutes before 2:00 PM ET, then CVD turning negative within one to three minutes of Powell's statement. The initial response to the language — not the rate decision — set the direction.
The January 2026 meeting was the pattern running clean. Hold confirmed at 2:00 PM. Powell's press conference began at 2:30 PM. His language on inflation persistence and the pace of future cuts was more hawkish than the market expected from a hold. CVD turned negative before the press conference ended. Liquidation clusters below $88,000 began firing by 3:00 PM. BTC was at $86,200 by close.
Reading the FOMC in QuantFlows isn't about predicting Powell's words. It's about watching how the order book and CVD respond to them in real time — faster than any narrative forms on financial media.
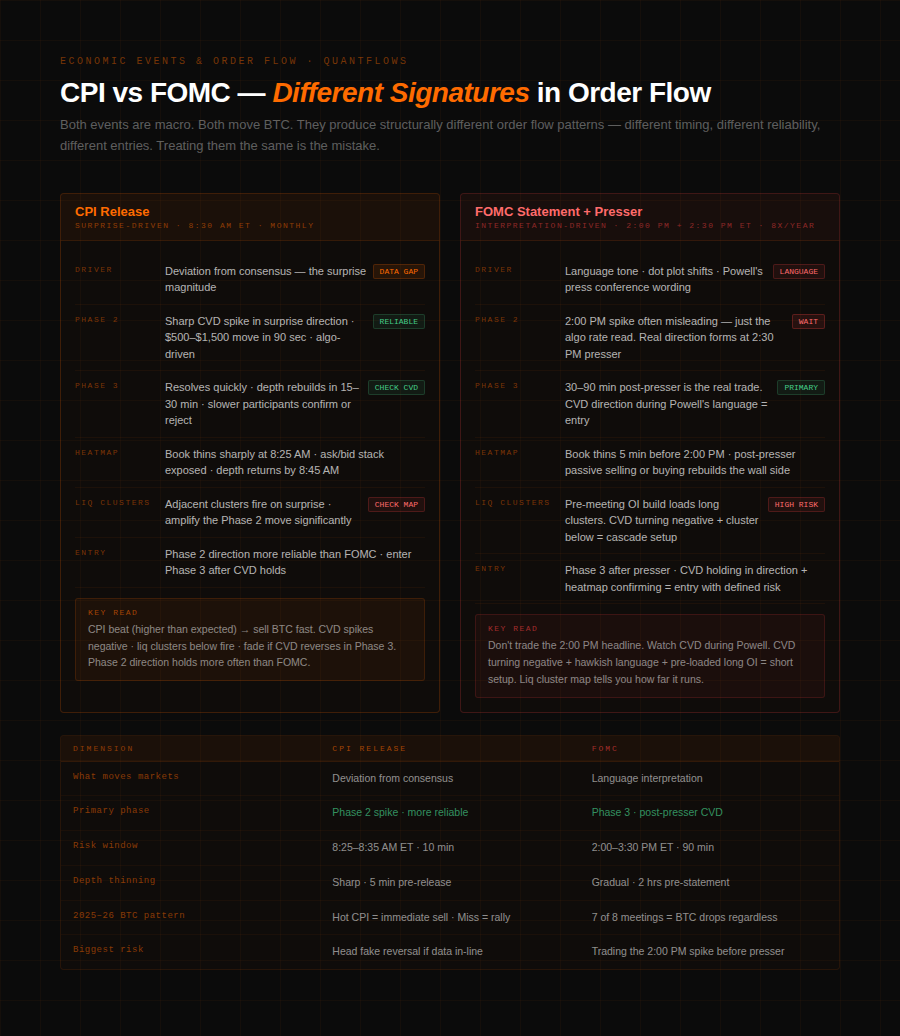
CPI vs FOMC: Different Events, Different Signatures
CPI and FOMC produce structurally different order flow patterns, and treating them the same is a common mistake.
CPI is a surprise-driven event. The market forms a consensus expectation — say, 3.1% YoY — and the number either confirms it or deviates. Deviation is what moves the market. A beat of 30 basis points or more triggers an immediate algorithmic response. The order flow spike is sharp, concentrated in the first 30 to 90 seconds, and then resolves into Phase 3 relatively quickly as the information is digested. In QuantFlows, a CPI surprise shows as a single violent CVD move — often $500 to $1,500 in BTC price impact within the first minute — followed by a more measured Phase 3 read as slower participants and institutional desks form their assessment.
FOMC is an interpretation event. The rate decision is rarely the variable — it's almost always priced in. What moves the market is the statement language, the dot plot, and Powell's press conference. This means the initial CVD move at 2:00 PM ET may be misleading — a reflexive algorithmic read of the headline rate number — and the true directional move develops over the following 30 to 90 minutes as the language is parsed. Watching CVD flatten and then reverse during Powell's presser, while the heatmap shows passive selling rebuilding on the ask side, is the signal to fade the initial reaction.
A useful heuristic: for CPI, the Phase 2 spike direction is more reliable. For FOMC, Phase 3 is the real trade.
Using QuantFlows Around Economic Events
Three specific applications make order flow data actionable around macro releases.
Pre-event positioning check. In the 30 minutes before a scheduled release, watch CVD direction and the Bubble Market Dots for size. If CVD is drifting significantly in one direction on meaningful Bubble Dots before the number drops, someone with size has a view. That drift doesn't guarantee the outcome, but it tells you the pre-positioning isn't neutral — there's institutional conviction already in the market that will amplify the move in whatever direction it goes.
Liquidation cluster awareness. Load the liquidation cluster map before the event. Identify where the nearest dense long and short clusters sit relative to current price. A CPI beat combined with a dense long cluster 3% below current price means the initial sell spike has fuel — forced liquidations will amplify the move beyond what the data alone would justify. A miss combined with a dense short cluster 2% above means any initial rally will accelerate sharply through short squeezes.
Post-event CVD confirmation. The 15 minutes after a print are where the real positioning trade lives. If Phase 2 spiked upward on a CPI miss and Phase 3 shows CVD holding elevated with bid depth rebuilding on the heatmap — the move is real, and continuation entries with defined risk above the event level make structural sense. If CVD reverses in Phase 3 and passive selling appears on the heatmap, the initial spike was algorithmic noise and the reversal trade has the better odds.
The macro calendar is fixed. The order flow around it is live. The gap between knowing the event is coming and reading how the market actually responds to it — that's where QuantFlows operates.
QuantFlows shows live heatmap depth, CVD, liquidation clusters, and Bubble Market Dots across Binance, Bybit, OKX, and Hyperliquid simultaneously. Free during beta at quantflows.xyz.